Assessment Tools
Assign | Assess | Analyse
Quick Quiz
Objective Assessment
Question Bank
List Of Questions With Key, Aswers & Solutions
Back To Learn
Re – Learn
Go Back To Learn Again
Class Level Content Of A Subject
Assign | Assess | Analyse
Objective Assessment
List Of Questions With Key, Aswers & Solutions
Back To Learn
Go Back To Learn Again
Mind Map Overal Idea Content Speed Notes Quick Coverage Ratio: Comparing by division is called ratio. Quantities written in ratio have the sameunit. Ratio has no unit. (Scroll down till end of the page) Study Tools Audio, Visual & Digital Content Equality of two ratios is called proportion. Product of extremes = Product of meansPercentage: readmore
Overal Idea
Content
Quick Coverage
Ratio: Comparing by division is called ratio. Quantities written in ratio have the sameunit. Ratio has no unit. (Scroll down till end of the page)
Audio, Visual & Digital Content
Equality of two ratios is called proportion. Product of extremes = Product of means
Percentage: Percentage means for every hundred. The result of any division in
whichthe divisor is 100 is a percentage. The divisor is denoted by a special
symbol %, read as percent. Profit and Loss:
(i) Cost Price (CP): The amount for which an article is bought. (ii) Selling Price (SP): The amount for which an article is sold. Additional expenses made after buying an article are included in the cost price
and are known as overhead expenses. These may include expenses like amount
spent onrepairs, labour charges, transportation, etc. Discount is a reduction given on marked price. Discount = Marked Price – Sale
Price. Discount can be calculated when discount percentage is given. Discount
Topic Terminology
Term
Table:
.
Test Your Learning
Mind Map Overal Idea Content Speed Notes Quick Coverage Comparing Quantities: Weare often requiredto compare two quantities, in our dailylife. They may be heights, weights, salaries, marks etc. To compare two quantities, their units must be the same. We are often required to compare two quantities in our daily life. They may be heights, weights,salaries, readmore
Overal Idea
Content
Quick Coverage
Comparing Quantities: Weare often requiredto compare two quantities, in our dailylife. They may be heights, weights, salaries, marks etc. To compare two quantities, their units must be the same.
We are often required to compare two quantities in our daily life. They may be heights, weights,salaries, marks etc. (Scroll down till end of the page)
Audio, Visual & Digital Content
While comparing heights of two persons with heights150 cm and 75 cm, we write it as the ratio 150 : 75 or 2 : 1.
Ratio: A ratio compares two quantities using a particular operation.
Percentage: Percentage are numerators of fractions with denominator 100. Percent is represent by the symbol% and means hundredth too.
Two ratios can be compared by converting them to like fractions. If the two fractions are equal,we say the two given ratios are equivalent.
If two ratios are equivalent then the four quantities are said to be in proportion. For example, the ratios 8 : 2 and 16 : 4 are equivalent therefore 8, 2, 16 and 4 are in proportion.
A way of comparing quantities is percentage. Percentages are numerators of fractions with denominator 100. Per cent means per hundred. For example 82% marks means
82 marks out of hundred.
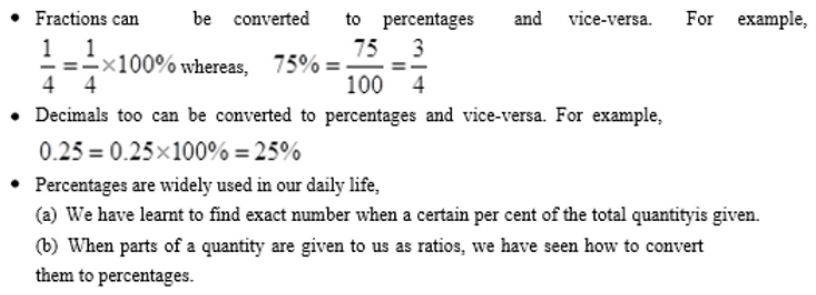
Percentages are widely used in our daily life,
(a) We have learnt to find exact number when a certain per cent of the total quantity is given.
(b) When parts of a quantityare given to us as ratios, we have seen how to convert
them to percentages.
(c) The increase or decrease in a certainquantity can also be expressed as percentage.
(d) The profit or loss incurredin a certain transaction can be expressedin terms of percentages.
(e) While computing intereston an amount borrowed, the rate of interest is given in terms of per cents. For example, ` 800 borrowed for 3 years at 12% per annum. Simple Interest:Principal means the borrowed money.
The extra money paid by borrower for using borrowedmoney for given time is called interest(I).
The period for which the money is borrowed is called ‘TimePeriod’ (T).
Rate of interestis generally given in percentper year.
Interest, I = PTR/100
Total money paid by the borrower to the lenderis called the amount.
Topic Terminology
Term
Table:
.
Test Your Learning
Mind Map Overal Idea Content Speed Notes Quick Coverage Nervous system is the organ system present in the animals to control and coordinate different activities of the body. Nervous system comprises ofthe brain, thespinal cord, anda huge network of nerves thatare spread throughout the body. The nervous system is responsible for sending, receiving and processing readmore
Overal Idea
Content
Quick Coverage
Nervous system is the organ system present in the animals to control and coordinate different activities of the body.
Nervous system comprises ofthe brain, thespinal cord, anda huge network of nerves thatare spread throughout the body.
The nervous system is responsible for sending, receiving and processing messages in the form of chemical signals called as impulses. (Scroll down till end..)
Audio, Visual & Digital Content
Animals- Nervous System:
Nervous system is the organ system present in the animals to control and coordinate different activities of the body.
Nervous system comprises ofthe brain, thespinal cord, anda huge network of nerves thatare spread throughout the body.
The nervous system is responsible for sending, receiving and processing messages in the form of chemical signals called as impulses.
Nervous tissue is made up of an organized network of nerve cells or neurons.
It is specialized for conducting information via electrical impulses from one part of the body to another.
A neuron is the basic unit of the nervous system. Each neuron consists of three parts, namely, the cell body or cyton, branched projections called dendrites, the long process from the cell body, called the axon.
Synapse is a gap between two neurons.
Nerves are thread like structures emerging out of the brain and spinal cord.
Nerves branch out to all parts of the body and are responsible of carrying messages in the body.
Types of nerve cells or neurons:
Reflex action:
What happens in reflex actions?
A reflex action, differently known as a reflex, is an involuntary and nearly instantaneous movement in response to a stimulus.
Reflex is an action generated by the body in response to the environment.
The process of detecting signal or the input and responding to it by an output action might be completed quickly. Such a connection is commonly called a reflex arc.
Reflex arcs are formed in the spinal cord itself; although the information input goes onto reach the brain.
In higher animals, most sensory neurons do not pass directly in to the brain, but synapse in the spinal cord.
Reflex arc continue to be more efficient for quick response.
Human brain:
Types of nervous system
The nervous system is divided into two systems as
Central nervous system:
Central nervous system includes the brain and the spinal cord.
It receives information from the body and sends out instructions to particular organs.
The brain has three such major parts or regions namely the fore brain, mid brain and hind brain.
Forebrain:
The forebrain is the main thinking part of the brain.
It consists of the cerebrum and diencephalon.
The cerebrum is the seat of memory and intelligence, and of sensory centres like hear, smell and sight.
The diencephalon is the seat for pressure and pain.
Midbrain:
The midbrain connects the forebrain to the hindbrain and controls the reflexes for sight and hearing.
Hindbrain:
The hindbrain consists of the cerebellum, pons and medulla.
The cerebellum coordinates muscular activities and maintains balance and posture.
The medulla controls involuntary activities like blood pressure, salivation, vomiting and heartbeat.
The spinal cord extends from the medulla of the brain through the whole length of the vertebral column and is protected by the vertebral column or backbone. Peripheral nervous system:
Peripheral nervous system consists of the cranial and spinal nerves arises from the brain and spinal cord respectively.
How are the tissues protected? Human brain is protected by the thick bones of the skull and a fluid called cerebrospinal fluid which provides further shock absorption.
How does the nervous tissue cause action? When a nerve impulse reaches the muscle the muscle fibre must move.
The muscle cells will move by changing their shape so that they shorten.
Muscle cells have special proteins that change both their shape and their arrangement in the cellin response to nervous electrical impulses.
When this happens new arrangements of these proteins give the muscle cells a shorter form.
Coordination in plants:
All living things respond to environmental stimuli.
Plants also respond to stimuli with the helpof chemical compounds secreted by thecells.
Plants being living organisms, exhibit some movements.
Plants show two different types of movements.
Types of movements shown by the plants are:
The plants also use electrical chemical means to convey this information from cellto cell but there is nospecialized tissue in plants for the conduction of information.
Plants respond to stimuli slowly by growing in a particular direction.
Because this growth is directional it appears as if the plant is moving.
Directional movements or Tropic movements:
Directional movements are also called as tropic movements.
Chemotropism is a growth movement of a plant part in response to chemical stimulus.
e.g. Growth of pollen tubes towards ovules.
Hormones
Hormones are the chemical compounds released by stimulated cells.
Hormones diffuse all around the cell.
They are synthesised at places away from where they act and simply diffuse to the area of action.
Different plant hormones help to coordinate growth, development and responses to the environment.
Different hormones secreted by the plants are auxins, gibberellins, cytokinins, abscisic acid.
Auxins are the hormones synthesised at the tip of the stem. These help the plants in growth by cell elongation.
Auxin induces shoot apicaldominance.
Gibberellins are hormones that help in the growth of the stem, seed germination, bolting, and flowering.
Cytokinins are hormones present in the areas of rapid cell division, such as fruits and seeds.
They also promote the opening of the stomata.
Abscisic acid is a hormone that inhibits the growth in various parts.
It is also responsible for the closure of stomata. Its effects include wilting of leaves.
Hormones in Animals: Endocrine system is the system formed by ductless glands which secrete chemical substances called as hormones.
Endocrine glands release hormones directly in to the blood. Hormones are minute, chemical messengers thrown into blood to act on target organs.
Endocrine glands
Different types of endocrine glands present in our body are the pituitary gland, pineal gland, hypothalamus, thyroid, parathyroid, thymus, adrenal gland, pancreas, testes and ovary.
Adrenal glands:
These are located above kidneys.
Two regions of the adrenal gland are adrenal cortex and adrenal medulla.
• Adrenal cortex secretes the hormones like cortisol, aldosterone and androgens.
• Adrenal medulla secretes the hormones like adrenaline andnoradrenaline.
Adrenaline is also called the “hormone of fight or flight,” or the emergency hormone.
It prepares the body to face an emergency condition of physical stress, like danger, anger and excitement.
Thyroid gland:
• It is located in the neck, ventral to thelarynx. • It is the one of the largest endocrine glands. • The principal hormones produced by this gland are triiodothyronine and thyroxine.
• Thyroxine is a hormone that regulates the metabolism of carbohydrates, proteins and fats in the body.
Iodine is essential for the synthesis of thyroxin.
Deficiency of iodine in food causes goiter.
One of the symptoms of this disease is a swollen neck.
The pituitary gland:
• It is located at the base of the brain. • It is considered to be master gland as it secretes many hormones to regulate organs as wellas the other glands. • Different hormones secreted by this gland include Growth hormone, TSH, FSH, LH, ACTH, MSH, Vasopressin and Oxytocin.
Growth hormone regulates growth and development of the body. If there is a deficiency of this hormone in childhood, it leads to dwarfism.
Excess secretion of this hormone leads to gigantism.
Gonads:
Two types of gonads present in human beings are female gonads and male gonads.
Female gonads
• A pair of ovaries forms the gonads in female. • Ovaries are the female sex organs that lie one on either side of the abdominal cavity.
Ovaries produce two hormones, namely, oestrogen and progesterone. • Oestrogen controls the changes that occur during puberty, like feminine voice, soft skin and development in mammary glands. • Progesterone controls the uterine changes in the menstrual cycle, and helps in the maintenance of pregnancy.
Male gonads
• A pair of testes forms the gonads in males. • A pair of testes isthe male sexorgan located inthe scrotum, whichis outside theabdomen. • Testes produce the hormone testosterone. • Testosterone controls the changes, whichoccur during puberty, like deeper voice, development of penis, facial and bodyhair.
Pancreas: It is located just below the stomach within the curve of the duodenum. It is both exocrine and endocrine in function. • It secretes hormones such as insulin, glucagon, somatostatin and pancreatic polypeptide. • Insulin regulates the sugar level inour blood.
Insulin secreted in small amounts increases the sugar level in our blood which in turn causes a disease called diabetes mellitus.
Pineal gland: • It is located near the centre of the brain, dorsal to the diencephalon. • It produces the hormone melatonin. • Melatonin affects reproductive development, modulation of wake and sleep patterns, and seasonal functions.
Hypothalamus: • It is a neuro-endocrine part of the brain. • It links the nervous system and the endocrine system through the pituitary gland. • Hormones likeStomatostatin, Dopamine aresecreted by thisgland.
Parathyroid glands:
• These are two pairs of small, oval-shaped glands embedded on the dorsal surface of the thyroid gland present in theneck. • They secrete parathormone.
parathormone helps in regulation of calcium and phosphate ions inthe bones and blood. • Hypo secretion leads to tetany and hypersecretion causes osteoporosis.
Thymus gland:
• It is located infront of the heart, in the upper part ofthe sternum. • It produces the hormone thymosine. • It helps in the maturation of T-lymphocytes.
The timing and amount of hormones released are regulated by feedback mechanisms.
For example, if the sugar levels in blood rise, they are detected by the cells of pancreas which respond by producing more insulin.
As the blood sugar level falls, insulin secretion is reduced.
Topic Terminology
Term:
Topic Terminology
Term:
Test Your Learning
Assign | Assess | Analyse
Objective Assessment
List Of Questions With Key, Aswers & Solutions
Back To Learn
Go Back To Learn Again
Mind Map Overal Idea Content Speed Notes Quick Coverage Cartesian System A plane formed by two number lines, one horizontal and the other vertical, such that they intersect each other at their zeroes, and then they form a Cartesian Plane. (Scroll down till end of the page) Study Tools Audio, Visual & Digital Content Coordinate readmore
Overal Idea
Content
Quick Coverage
Cartesian System

A plane formed by two number lines, one horizontal
and the other vertical, such that they intersect each
other at their zeroes, and then they form a Cartesian
Plane. (Scroll down till end of the page)
Audio, Visual & Digital Content
Coordinate Axes:

The position of a point in a plane is fixed by selecting the axes of reference which are formed by two number lines intersecting each other at right angles, so that their zeroes coincide.
The horizontal number line is called x-axis and vertical number line is called y axis.
A point that lies on X Axis is (x,0)
A point that lies on Y Axis is (0,y)
Equation of Y Axis is x = 0
Equation of X Axis is y = 0
Equation of a lne parallel to Y Axis is x = a
Equation of a lne parallel to X Axis is y = a
Equation of a lne perpendicular to X Axis is X = a
Equation of a lne perpendicular to X Axis is X = a
The point of intersection of the two lines is called origin.

is the x-axis and Y1OY is the y-axis. These coordinate axes are also called rectangular axes as they are perpendicular to each other.
Rectangular coordinates are ordered pairs in which the first element is called the abscissa and the second element is called the ordinate.


● In the first quadrant, x is + ve and y is + ve
● In the second quadrant, x is – ve and y is + ve
● In the third quadrant, x is – ve and y is – ve
● In the fourth quadrant, x is + ve and y is -ve.
Distance Formula:

Example:

Example:
Collinearity of three points:

Three points P, Q and R are said to be collinear, if they lie in the same straight line.
i.e., PR = PQ + QR
i.e., PQ = PR + RQ
i.e., QR = QP + PR
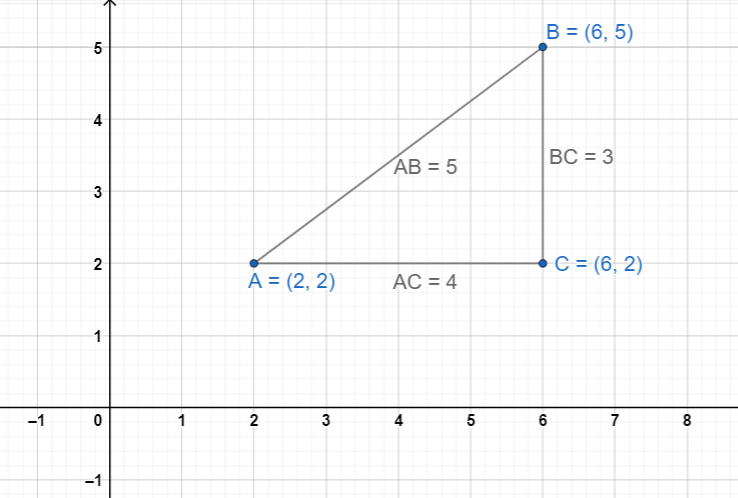
If three points are not collinear, they always form a triangle.
Special Polygons:
(i) In Case of Triangle
(a) a right-angled triangle, if sum of squares of any two sides is equal to square of third side.
(b) an equilateral triangle, if all the three sides are equal.
(c) an isosceles triangle, if any two sides are equal.
(ii) In Case of Quadrilateral
(a) parallelogram, if opposite sides are equal and diagonals are not equal.
(b) rectangle, if opposite sides are equal and diagonals are equal.
(c) square, if all the four sides are equal and diagonals are equal.
(d) rhombus, if all the four sides are equal and diagonals are not equal.
Section Formula (Internal division only)

Midpoint Formula:

Point Dividing Two points in K : 1 Ratio:

Note:
If k is positive, the point divides the given points internally.
If k is Negative, the point divides the given points externally
Coordinates of the centroid of a triangle:

Points of Trisection:

If a line segment is divided into three equal parts by two points, the points are said to be the points of trisection.
In the given figure, the points R and S divide the line segment PQ into three equal parts i.e., PR=RS=SQ. The points R and S are said to be points of trisection.
Area of a Triangle:
The area of the triangle formed by the points

is calculated by the following expression.
Area of ∆PQR =

Area of Quadrilateral:

Area of a quadrilateral can be found by splitting up the quadrilateral into two triangles and sum up their areas.
Thus, area of quadrilateral PQRS = area of ∆PQR+ area of ∆PRS

Condition for collinearity of three points :
Three given points will be collinear, if the area of the triangle formed by these points is zero.
Rule to prove that three given points are collinear:
Step 1. Find the area of the triangle formed by the given points.
Step 2. Show that the area of the triangle formed by the given points is zero.
* The coordinates of the origin are O(0,0)
* The coordinates of any point on x-axis are (x, 0)
i.e., y=0 or ordinate is zero.
* The coordinates of any point on y – axis are (0, y) i.e., x=0 or abscissa is zero.
Topic Terminology
Term
Table:
.
Test Your Learning
Assign | Assess | Analyse
Objective Assessment
List Of Questions With Key, Aswers & Solutions
Back To Learn
Go Back To Learn Again
Mind Map Overal Idea Content Speed Notes Quick Coverage Data: A collection of numbers gathered to give someinformation. Recording Data:Data can becollected from different sources. Pictograph: The representation of data through pictures of objects. It helps answer the questions onthe data ata glance. (Scroll down till end of the page) Study Tools Audio, Visual & readmore
Overal Idea
Content
Quick Coverage
Data: A collection of numbers gathered to give someinformation. Recording Data:Data can becollected from different sources. Pictograph: The representation of data through pictures of objects. It helps answer the questions onthe data ata glance. (Scroll down till end of the page)
Audio, Visual & Digital Content
Bar Graph: Pictorial representation of numerical datain the formof bars (ractangles) of equal width and varying heights. We have seen that data is a collection of numbers gathered to give some information.
To get a particular information from the givendata quickly, thedata can be arranged ina tabular formusing tally marks. We learnt how a pictograph represents data in the formof pictures, objects or parts ofobjects.
We have also seen how to interpret a pictograph and answer the related questions.
We havedrawn pictographs using symbols to represent a certain number of items orthings.
We havediscussed how torepresent data byusing a bardiagram or abar graph.
Ina bar graph, bars of uniform width are drawn horizontally or vertically with equal spacing between them.
Thelength of eachbar gives therequired information.
To do this we also discussed the process of choosing a scale for the graph. For example, 1unit = 100students.
We havealso practised reading a given bargraph.
We have seen howinterpretations from thesame can bemade.
Topic Terminology
Term
Table:
.
Test Your Learning
Mind Map Overal Idea Content Speed Notes Quick Coverage Content : (Scroll down till end of the page) Study Tools Audio, Visual & Digital Content Content … Key Terms Topic Terminology Term Important Tables Table: . Assessments Test Your Learning readmore
Overal Idea
Content
Quick Coverage
Content : (Scroll down till end of the page)
Audio, Visual & Digital Content
Content …
Topic Terminology
Term
Table:
.
Test Your Learning