Assessment Tools
Assign | Assess | Analyse
Quick Quiz
Objective Assessment
Question Bank
List Of Questions With Key, Aswers & Solutions
Back To Learn
Re – Learn
Go Back To Learn Again
Class Level Content Of A Subject
Assign | Assess | Analyse
Objective Assessment
List Of Questions With Key, Aswers & Solutions
Back To Learn
Go Back To Learn Again
Mind Map Overal Idea Content Speed Notes Quick Coverage Cartesian System A plane formed by two number lines, one horizontal and the other vertical, such that they intersect each other at their zeroes, and then they form a Cartesian Plane. (Scroll down till end of the page) Study Tools Audio, Visual & Digital Content Coordinate… readmore
Overal Idea
Content
Quick Coverage
Cartesian System

A plane formed by two number lines, one horizontal
and the other vertical, such that they intersect each
other at their zeroes, and then they form a Cartesian
Plane. (Scroll down till end of the page)
Audio, Visual & Digital Content
Coordinate Axes:

The position of a point in a plane is fixed by selecting the axes of reference which are formed by two number lines intersecting each other at right angles, so that their zeroes coincide.
The horizontal number line is called x-axis and vertical number line is called y axis.
A point that lies on X Axis is (x,0)
A point that lies on Y Axis is (0,y)
Equation of Y Axis is x = 0
Equation of X Axis is y = 0
Equation of a lne parallel to Y Axis is x = a
Equation of a lne parallel to X Axis is y = a
Equation of a lne perpendicular to X Axis is X = a
Equation of a lne perpendicular to X Axis is X = a
The point of intersection of the two lines is called origin.

is the x-axis and Y1OY is the y-axis. These coordinate axes are also called rectangular axes as they are perpendicular to each other.
Rectangular coordinates are ordered pairs in which the first element is called the abscissa and the second element is called the ordinate.


● In the first quadrant, x is + ve and y is + ve
● In the second quadrant, x is – ve and y is + ve
● In the third quadrant, x is – ve and y is – ve
● In the fourth quadrant, x is + ve and y is -ve.
Distance Formula:

Example:

Example:
Collinearity of three points:

Three points P, Q and R are said to be collinear, if they lie in the same straight line.
i.e., PR = PQ + QR
i.e., PQ = PR + RQ
i.e., QR = QP + PR
If three points are not collinear, they always form a triangle.
Special Polygons:
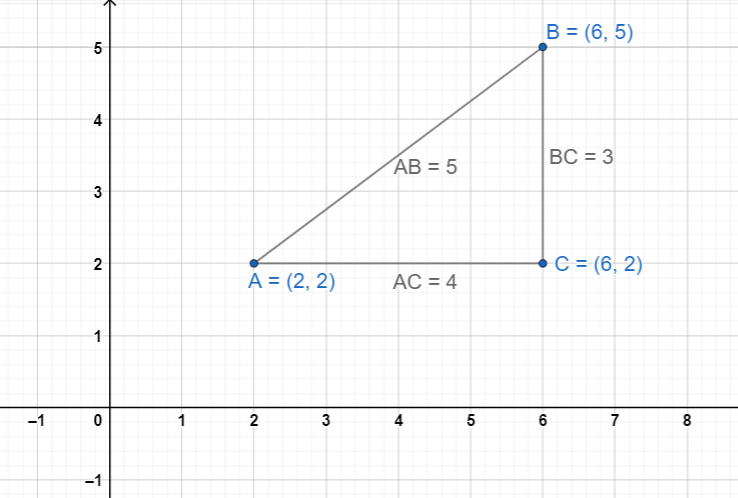
(i) In Case of Triangle
(a) a right-angled triangle, if sum of squares of any two sides is equal to square of third side.
(b) an equilateral triangle, if all the three sides are equal.
(c) an isosceles triangle, if any two sides are equal.
(ii) In Case of Quadrilateral
(a) parallelogram, if opposite sides are equal and diagonals are not equal.
(b) rectangle, if opposite sides are equal and diagonals are equal.
(c) square, if all the four sides are equal and diagonals are equal.
(d) rhombus, if all the four sides are equal and diagonals are not equal.
Section Formula (Internal division only)

Midpoint Formula:

Point Dividing Two points in K : 1 Ratio:

Note:
If k is positive, the point divides the given points internally.
If k is Negative, the point divides the given points externally
Coordinates of the centroid of a triangle:

Points of Trisection:

If a line segment is divided into three equal parts by two points, the points are said to be the points of trisection.
In the given figure, the points R and S divide the line segment PQ into three equal parts i.e., PR=RS=SQ. The points R and S are said to be points of trisection.
Area of a Triangle:
The area of the triangle formed by the points

is calculated by the following expression.
Area of ∆PQR =

Area of Quadrilateral:

Area of a quadrilateral can be found by splitting up the quadrilateral into two triangles and sum up their areas.
Thus, area of quadrilateral PQRS = area of ∆PQR+ area of ∆PRS

Condition for collinearity of three points :
Three given points will be collinear, if the area of the triangle formed by these points is zero.
Rule to prove that three given points are collinear:
Step 1. Find the area of the triangle formed by the given points.
Step 2. Show that the area of the triangle formed by the given points is zero.
* The coordinates of the origin are O(0,0)
* The coordinates of any point on x-axis are (x, 0)
i.e., y=0 or ordinate is zero.
* The coordinates of any point on y – axis are (0, y) i.e., x=0 or abscissa is zero.
Topic Terminology
Term
Table:
.
Test Your Learning

Assign | Assess | Analyse
Objective Assessment
List Of Questions With Key, Aswers & Solutions
Back To Learn
Go Back To Learn Again
Mind Map Overal Idea Content Speed Notes Quick Coverage Data: A collection of numbers gathered to give someinformation. Recording Data:Data can becollected from different sources. Pictograph: The representation of data through pictures of objects. It helps answer the questions onthe data ata glance. (Scroll down till end of the page) Study Tools Audio, Visual &… readmore
Overal Idea
Content
Quick Coverage
Data: A collection of numbers gathered to give someinformation. Recording Data:Data can becollected from different sources. Pictograph: The representation of data through pictures of objects. It helps answer the questions onthe data ata glance. (Scroll down till end of the page)
Audio, Visual & Digital Content
Bar Graph: Pictorial representation of numerical datain the formof bars (ractangles) of equal width and varying heights. We have seen that data is a collection of numbers gathered to give some information.
To get a particular information from the givendata quickly, thedata can be arranged ina tabular formusing tally marks. We learnt how a pictograph represents data in the formof pictures, objects or parts ofobjects.
We have also seen how to interpret a pictograph and answer the related questions.
We havedrawn pictographs using symbols to represent a certain number of items orthings.
We havediscussed how torepresent data byusing a bardiagram or abar graph.
Ina bar graph, bars of uniform width are drawn horizontally or vertically with equal spacing between them.
Thelength of eachbar gives therequired information.
To do this we also discussed the process of choosing a scale for the graph. For example, 1unit = 100students.
We havealso practised reading a given bargraph.
We have seen howinterpretations from thesame can bemade.
Topic Terminology
Term
Table:
.
Test Your Learning
Mind Map Overal Idea Content Speed Notes Quick Coverage Content : (Scroll down till end of the page) Study Tools Audio, Visual & Digital Content Content … Key Terms Topic Terminology Term Important Tables Table: . Assessments Test Your Learning readmore
Overal Idea
Content
Quick Coverage
Content : (Scroll down till end of the page)
Audio, Visual & Digital Content
Content …
Topic Terminology
Term
Table:
.
Test Your Learning
Assign | Assess | Analyse
Objective Assessment
List Of Questions With Key, Aswers & Solutions
Back To Learn
Go Back To Learn Again
Mind Map Overal Idea Content Speed Notes Quick Coverage Matter: Anything that occupies space is called matter. Example: Air, water, rock etc., Matter exists in our surroundings in both pure and impure forms. (Scroll down till end of the page) Study Tools Audio, Visual & Digital Content Mixture: A mixture is a matter that contains… readmore
Overal Idea
Content
Quick Coverage
Matter: Anything that occupies space is called matter.
Example: Air, water, rock etc.,
Matter exists in our surroundings in both pure and impure forms. (Scroll down till end of the page)
Audio, Visual & Digital Content
Mixture: A mixture is a matter that contains more than one pure substance in any ratio/proportion.
A mixture is an impure form of matter.
Example:
Water in milk, lemon juice, Ginger Garlic paste, etc.,
The mixture may or may not be separated into its constituent particles by physical processes.
Substance: A matter that cannot be separated into its constituent particles by any physical process is known as a substance.
Example:
Solution: A homogeneous mixture of two or more substances is called a solution.
Example:
Tea, sugar, and common salt are dissolved in water.
Alloy: A homogeneous mixture of metals is called an alloy.
Properties of the Solution:
Concentration of solution: The concentration of a solution is the amount of solute present in a given quantity of the solution.

Unsaturated and Saturated Solutions: a solution in which a larger quantity of solute can be dissolved without raising its temperature, is called an unsaturated solution.
• A solution in which no more solute can be dissolved at a certain temperature, is called a saturated solution.
Solubility: The maximum amount of a solute that can be dissolved in 100 grams of a solvent at a specified temperature is known as the solubility of the solute in that solvent.
Suspension: a heterogeneous mixture of solids and liquids where the solid particles are suspended throughout the medium.
Example: Mixture of chalk powder and water
Properties of Suspension
• Particles are visible to the naked eye
• Light path in a suspension is visible
• Particles settle down
Colloidal Solution: Colloidal Solution Is a heterogeneous mixture, but appears to be homogeneous.
Examples: Milk, soap lather, soda water, pumice stone, rubber, bread, fog, cloud, insecticide spray, butter, etc.
Properties of colloidal solutions
• Heterogeneous mixture
• Particle size is small, not visible to the naked eye
• Light path can be visible;
• Particles do not settle down
• Substances cannot be separated by filtration
Tyndall Effect: Scattering of light beam by suspended particles in the solution.
Physical and Chemical changes:
Physical and change: The changes in which no new substances are formed are called physical changes.
Chemical change: The changes in which new substances are formed are called chemical changes.
SEPARATION OF MIXTURES
The method of separation depends on both the type of mixture and the physical properties of its constituents.
These are :
(i) The physical state of the constituents.
(ii) The differences in the physical properties
of the constituents, such as:
(a) boiling point
(b) melting point
(c) density
(d) magnetic properties
(e) ability to sublime
(f) volatility
(g) solubility in various solvents.
• Evaporation: Used for separating mixtures of volatile solvents and non-volatile solutes.
Working Principle:
One component should be non-volatile. It may or may not be soluble in water.
Example: Separating salt from its solution
• Centrifugation used for separating components based on the difference in their weights.
Working Principle:
Difference in the densities of two liquids.
Example: Separating mixtures of cream from milk
• Separating Funnel: Used for separating two or more immiscible liquids.
Working Principle:
Immiscible liquids with different densities get separated into different layers if they are in the same container.
Example: Separating oil and water
Sublimation:
Sublimation is the process of converting a solid into vapour and returning it to the solid state without passing through the liquid state.
Sublimation is used to separate sublimable solids from their mixtures.
Working Principle:
One of the components can be sublime.
Example: Separating ammonium chloride from a mixture
Chromatography:
The process of separating the different dissolved constituents of a mixture by their adsorption (adsorption refers to the collection of one substance on the surface of another substance.) over an appropriate adsorbing material is called chromatography.
Chromatography is used to separate those solutes that dissolve in the same solvent.
Working Principle:
Adsorption/partition
Example: Separating the components of a dye
Distillation:
Distillation is the process of heating a liquid to convert it into vapours and then condensing the vapours back into a liquid.
Distillation is used to separate two miscible liquids that boil without decomposition.
Working Principle:
One component should be a soluble solid in a liquid.
Example: Separating a mixture of acetone and water
Fractional distillation
Fractional distillation is a process that involves the distillation and collection of fractions or different liquids boiling at different temperatures.
Fractional distillation is used to separate a mixture of liquids when their boiling temperatures differ by less than 25 K.
Example: Separating different components of petroleum
Crystallization: Used to separate pure solids from a solution by forming crystals.
Working Principle:
A solid dissolved in a liquid is separated by evaporating the solvent completely by heating the mixture.
Example: Obtaining pure crystals of copper sulphate from an impure sample.
Differences Between Mixture And Compound
| Property | Mixture | Compound |
| Nature | When two or more elements or compounds or both are mixed together, such that they do not combine chemically, a mixture is formed. | When two or more elements unitechemically, a compound is formed. |
| Structure | Mixtures are generally heterogeneous. However, some mixtures can be homogeneous. | Compounds are always homogeneous. |
| Composition | In case of mixtures their constituents can be present in any ratio, i.e., mixtures havevariable composition. | In case of compounds, the constituents arepresent in a fixed ratio by weight. |
| Properties | The constituents of a mixture retain theirindividual chemical and physical properties. | The properties of a compound are entirelydifferent from the properties of itsconstituents |
| Separation of constituents | The constituents of a mixture can beseparated by applying physical methods likesolubility, filtration, evaporation, distillation,use of magnet, etc. | The constituents of a compound cannot beseparated by applying physical methods.However, constituents of a compound can beseparated by chemical means. |
| Energy change | There may or may not be energy changeduring the formation of mixture. | During the formation of a compound eitherthe energy is absorbed or given out. |
| Type of Mixture | Nature of Mixture | Example | Separation Method |
| Solid – solid | Heterogeneous | Iron + Sand; | Magnetic separation |
| Solid – solid | Heterogeneous | Iodine + Sand | Sublimation |
| Solid – solid | Heterogeneous | Iron + Sulphur | Solvent extraction |
| Solid – solid | Heterogeneous | Nitre + Common salt | Fractional crystallisation |
| Solid – liquid | Heterogeneous | Sand+Water; Clay + Water | Sedimentation-decantation |
| Solid – liquid | Heterogeneous | Chalk + Water; PbCl₂ + Water | Filtration |
| Solid – liquid | Homogeneous | Common salt in seawater | Evaporation |
| Solid – liquid | Homogeneous | Iodine + Methyl alcohol | Distillation |
| Liquid – liquid | Homogeneous | Methyl alcohol + Ethyl alcohol | Fractional distillation |
| Liquid – liquid | Homogeneous | Oil + Water; Mercury + Water | Separating funnel |
| Liquid – gas | Homogeneous | Ammonia + Water | Boiling of liquid |
| Complex Mixture | Homogeneous | Colouring matter in ink | Chromatography |
Topic Terminology
Term
Table:
.
Test Your Learning
Assign | Assess | Analyse
Objective Assessment
List Of Questions With Key, Aswers & Solutions
Back To Learn
Go Back To Learn Again
Mind Map Overal Idea Content Speed Notes Quick Coverage Matter: 1. Characteristics of Matter Particles Anything (Physical Material not emotions, feelings etc.) which has mass and volume (occupy space) is called matter. We feel the presence of matter by one or more of our five sense organs. Matter is made up of particles. (Scroll down… readmore
Overal Idea
Content
Quick Coverage
Matter:
1. Characteristics of Matter Particles
Anything (Physical Material not emotions, feelings etc.) which has mass and volume (occupy space) is called matter.
We feel the presence of matter by one or more of our five sense organs.
Matter is made up of particles. (Scroll down till end of the page)
Audio, Visual & Digital Content
Particles:
Particles are very small in size. Therefore we cannot see particles with our naked eye.
Characteristics of the particles of matter:
(1) All matter (elements or compounds) consists of very small particles which can exist independently and are called particles.
(ii) The particles of matter are in a state of continuous motion and possess kinetic energy.
(iii) There are intermolecular spaces in between the particles (molecules) of matter.
(iv) The particles (molecules) of matter attract each other with a force called intermolecular force.
Intermolecular force is maximum in solids and least in the gases.
These material particles can be touched, moved by changing temperature or attracted by decreasing or increasing forces of attraction or repulsion.
2. States of Matter
Matter exists in three different physical states namely solid, liquid and gas.
One substance such as water can exist in all the three states such as, ice in solid state, water in liquid state and steam or vapours in gaseous state.
The state of matter depends on temperature, forces of attraction between their constituent particles etc.
3. Interconversion of Matter
All these three different states of matter are interconvertible depending upon temperature and pressure.
The state of matter can be changed by changing temperature or pressure.
Due to change in temperature and pressure there will be a change in inter-particle space as well as force between them, resulting in change in physical state.
Examples:

4. Plasma: It is the fourth state of matter consisting of super energetic and super excited particles. These particles are in the form of ionised gases.
Examples:
These devices contain inert gases which get ionised due to the passage of electric current. The colour of the glowing plasma depends upon the nature of the gas.
5. Sublimation: The process in which a solid state directly changes into a gaseous state on heating or vice-versa on cooling.
6. Melting or Fusion: The process of changing a solid into a liquid state by absorbing heat at a constant temperature is known as Melting or Fusion.
7. Freezing or Solidification: The process of changing a liquid into solid state by losing heat at a constant temperature is known as Freezing or Solidification.
8. Condensation: The process of changing a gas into a liquid state by giving out heat at constant temperature is known as Condensation .
Boiling or Vaporisation : The process of changing a liquid into a gaseous state by absorbing heat at constant temperature is known as Boiling or Vaporisation .
Boiling is a bulk phenomenon. Particles from the bulk (whole) of the liquid change into a vapour state.
Evaporation: The phenomenon of changing the physical state from liquid to vapour, at any temperature is called evaporation.
Evaporation is a surface phenomenon. Particles from the surface gain required energy to overcome the forces of attraction present in the liquid and change into the vapour state.
The rate of evaporation depends upon the surface area exposed to the atmosphere, the temperature, the humidity and the wind speed.
Evaporation causes cooling.
Evaporation takes place at all temperatures, below the boiling point of a liquid
Factors affecting evaporation:
• Rate of evaporation increases with increase in surface area.
• Rate of evaporation increases with increase in temperature.
• Rate of evaporation increases with decrease in Humidity.
• Rate of evaporation increases with increase in wind speed.
Latent heat of boiling or Latent heat of Vaporisation: Latent heat of boiling or Latent heat of Vaporisation is the heat energy required to change 1 kg of a liquid to gas at atmospheric pressure at its boiling point.
Kelvin is the SI unit of temperature.
0°C = 273.16 K.
For convenience, we take 0°C = 273 K after rounding off the decimal.
To change a temperature on the Kelvin scale to the Celsius scale you have to subtract 273 from the given temperature, and to convert a temperature on the Celsius scale to the Kelvin scale you have to add 273 to the given temperature.
Conversion Formula: t°C = (t+273) K
Boiling point or Vaporisation point: Boiling point or Vaporisation point is the fixed temperature at which a liquid converts into a gaseous state at atmospheric pressure.
Melting point or Fusion point: Melting point or Fusion point is the temperature at which a solid starts converting into a liquid state at atmospheric pressure.
Evaporation Causes cooling: During evaporation the particles at the surface of the liquid gain energy from the surroundings and change into vapour.. Therefore Evaporation Causes cooling effect.
Sponge can be compressed although it is solid: Sponge contains minute holes in which air is trapped.So when it is pressed, the air gets expelled and the sponge gets compressed. Also,the material of the sponge is not rigid.
Temperature does not change during change of state: The temperature remains constant at its melting and boiling points (during change of state) until all the substance melts or boils.
Because the heat supplied is continuously used up in changing the state of the substance by overcoming the force of attraction between the particles.
There is no increase in the kinetic energy of the particles and thus, temperature does not change.
This heat energy absorbed without showing any rise in temperature is given the name latent heat of fusion/latent heat of vaporisation.
Effect of pressure on physical state of a substance:
If pressure is applied, melting point decreases and boiling point increases
When pressure is increased, the particles come closer and the force of attraction increases between them and this results in a change of state.
Example: When high pressure is applied to a gas by reducing its temperature, the particles of gas come close and get converted to a liquid. This is also known as liquefaction.
The amount of heat energy required in changing a 1 kg of solid into liquid at atmospheric pressure and its melting point is known as the latent heat of fusion.
[ Lice = 80 cal/g = 3.34 × 10⁵ J/kg].
• The amount of heat which is required to convert 1 kg of the liquid (at its boiling point) to vapours of gas without any change in temperature is known as latent heat of vaporisation.
[Lwater =540 cal/g= 22.5 × 10⁵ J/kg].
• The amount of heat absorbed or liberated , Q = mL.
• The specific heat is the amount of heat per unit mass required to raise the temperature by one degree Celsius.
• Q = m.s. t, where m = mass of the body, s = specific heat of the body and t is temperature difference and m.s is called thermal capacity.
• Change of liquid into vapours at any temperature below the boiling point.
Takes the latent heat from the body. Thus, the body cools when evaporation takes place.
Evaporation:
(1) Evaporation is a slow process.
(ii) Evaporation takes place at the surface mass of the liquid.
(iii) Evaporation takes place at all temperatures.
(iv) The substance becomes cool due to evapora- tion process.
(v) Heat is absorbed from the surroundings due to Evaporation. Absorption of heat from the surroundings causes cooling effect.
Boiling:
(1) Boiling is a rapid process.
(ii) Boiling takes place throughout the mass of a liquid.
(iii) Boiling takes place at a definite temperature called the boil- ing point.
(iv) The substance remains hot during the boiling process.
(v) Heat is required from an external source such as a burner for boiling to take place.
Scales of temperature
• Three scales are commonly used for measuring temperature, namely, the Celsius scale, the Fahrenheit scale and the Kelvin scale.
• The relation between the Celsius and the Kelvin scale can be expressed as:
C + 273 = K
• The relation between the Celsius and the Fahrenheit scale can be expressed as follows.
| Property | Solid | Liquid | Gas |
| Inter particle space | Very less | Larger than solid butlesser than gas | Very large |
| Inter particle force | Very strong | Weaker than solidbut stronger than gas | Very weak |
| Nature (Rigidity) | Very hard and rigid | Fluid | Highly fluid |
| Compressibility | Negligible | Very small | Highly compressible |
| Shape | Definite shape | Indefiniteshape | Indefinite Shape |
| Volume | Definite Volume | Indefinite shape | Indefinite volume |
| Density | high | Less than solid | Very low |
| Kinetic energy | low | high | Very high |
| Diffusion | Negligible | Slow | Very high |
Specific Heat
11.8 NATURAL PHENOMENA AND CONSEQUENCES OF HIGH SPECIFIC HEAT CAPACITY OF WATER
Some consequences of high specific heat capacity of water are given below.
(i) The climate near the seashore is moderate :
The specific heat capacity of water is very high (= 1000 cal kg-1 °C-1 or 4200 J kg-1 K-¹). It is about five times as high as that of sand. Hence the heat energy required for the same rise in temperature by a certain mass of water will be nearly five times that required by the same mass of sand.
Similarly, a certain mass of water will give out nearly five times more heat energy than that given by sand of the same mass for the same fall in temperature.
As such, sand (or earth) gets heated or cooled more rapidly as compared to water under similar conditions.
Thus, a large difference in temperature is developed between the land and the sea due to which land and sea breezes are formed”. These breezes make the climate near the seashore moderate.
(ii) Hot water bottles are used for fomentation: The reason is that water does not cool quickly due to its large specific heat capacity, so a hot water bottle provides heat energy for fomentation for a long time.
(iii) Water is used as an effective coolant: By allowing water to flow in pipes around the heated parts of a machine, heat energy from such parts is removed (e.g. radiators in car and generator are filled with water). Water in pipes extracts more heat from surroundings without much rise in its temperature because of its large specific heat capacity.
(iv) In cold countries, water is used as a heat reservoir for wine and juice bottles to avoid their freezing: The reason is that water due to its high specific heat capacity can impart a large amount of heat before reaching up to the freezing temperature. Hence bottles kept in water remain warm and they do not freeze even when the surrounding temperature falls considerably.
(v) Farmers fill their fields with water to protect the crops from frost: In the absence of water, if on a cold winter night, the atmospheric temperature falls below 0°C, the water in the fine capillaries of plants will freeze, so the veins will burst due to the increase in volume of water on freezing. As a result, plants will die and the crop will be destroyed. In order to save crop on such cold nights, farmers fill their fields with water because water has a high specific heat capacity, so it does not allow the temperature in the surrounding area of plants to fall up to 0°C.
(vi) All plants and animals have a high content of water in their bodies: All plants and animals have nearly 80% to 90% of water in their bodies so it helps in maintaining the body temperature nearly same in all seasons due to high specific heat capacity of water.
SOME EXAMPLES OF HIGH AND LOW THERMAL CAPACITY
(1) The base of a cooking pan is made thick : By making the base of the cooking pan thick, its thermal capacity becomes large and it imparts sufficient heat energy at a low temperature to the food for its proper cooking. Further it keeps the food warm for a long time, after cooking.
(2) The base of an electric iron is made thick and heavy: By doing so, the thermal capacity of the base becomes large and it remains hot for a long duration even after switching off the current.
(3) The vessel used for measurement of heat (i.e., calorimeter) is made of thin sheet of copper:
The reason is that the specific heat capacity of copper is low and by making the vessel thin, its thermal capacity becomes low so that it takes a negligible amount of heat from its contents to attain the temperature of the contents.
Topic Terminology
Term
Table:
.
Test Your Learning