Assessment Tools
Assign | Assess | Analyse
Quick Quiz
Objective Assessment
Question Bank
List Of Questions With Key, Aswers & Solutions
Back To Learn
Re – Learn
Go Back To Learn Again
Class Level Content Of A Subject
Assign | Assess | Analyse
Objective Assessment
List Of Questions With Key, Aswers & Solutions
Back To Learn
Go Back To Learn Again
Mind Map Overal Idea Content Speed Notes Quick Coverage Perimeter Perimeter is defined as the outside boundary of any closed shape. To calculate the perimeter of a given shape we need to add all the sides of the shape. Example: The perimeter of a rectangle is the sum of its all four sides. The unit… readmore
Overal Idea
Content
Quick Coverage
Perimeter
Perimeter is defined as the outside boundary of any closed shape.
To calculate the perimeter of a given shape we need to add all the sides of the shape.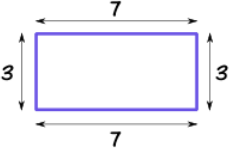
Example: The perimeter of a rectangle is the sum of its all four sides. The unit of the perimeter is the same as its length.
Perimeter of the Given rectangle = 3 + 7 + 3 + 7 cm
Perimeter of rectangle = 20 cm. (Scroll down till end of the page)
Audio, Visual & Digital Content
Area of any closed figure is the surface enclosed by the perimeter. Unit of Area is the square of the unit of length.
The general formula to find the area of a triangle, if the height is given, is

To find the area of a right-angled triangle, we use the formula:
right-angled triangle, we take the two sides having the right angle, one as the base and one as height.
Example: Calculate area of a triangle of the Figure.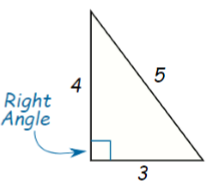
Data: base = 3 cm and height = 4 cm
Formula: Area of triangle = 1/2 × 3 × 4= 6 cm 2
Result: Area of a triangle of the Figure is 6 cm 2 .
Remark: If you take base as 4 cm and height as 3 cm then also the area of the triangle will remain the same.

Equilateral Triangle: Equilateral Triangle is defined as a triangle having three equal sides.
To calculate the area of the Equilateral Triangle ABC,
We calculate the height (altitude), AD by making the median of the triangle.
In the given example, the Height (altitude), AD touches Base of the equilateral triangle at the midpoint of BC, Say point, D.
Here the equilateral triangle ABC has three equal sides, such as:
AB = BC = AC = 10 cm.
Since, midpoint of BC divides the triangle into two right angle triangles.
The height, AD, is calculated using Pythagoras theorem.
According to Pythagoras theorem, AB2 = AD2 + BD2
On substituting the values we get,
(10)2 = AD2 + (5)2
AD2 = (10)2 – (5)2
AD2 = 100 – 25 = 75
AD = 5√3
Now we can find the area of the triangle using the formula:
Area of triangle = 1/2 × base × height
On substituting the values we get,
Area of triangle = 1/2 × 10 × 5√3
25√3 cm2

In the isosceles triangle also we need to find the height of the triangle then calculate the area of the triangle.
Here,

The formula of the area of a triangle given by herons is called Heron’s Formula.
Heron’s Formula:

where a, b and c are the sides of the triangle and s is the semiperimeter

Generally, this formula is used when the height of the triangle is not possible to find or you can say if the triangle is a scalene triangle.
Here the sides of triangle are
AB = 12 cm
BC = 14 cm
AC = 6 cm

If we know the sides and one diagonal of the quadrilateral then we can find its area by using the Heron’s formula.
Find the area of the quadrilateral if its sides and the diagonal are given as follows.
Given, the sides of the quadrilateral
AB = 9 cm
BC = 40 cm
DC = 28 cm
AD = 15 cm
Diagonal is AC = 41 cm
Here, ∆ABC is a right angle triangle, so its area will be

Area of Quadrilateral ABCD = Area of ∆ABC + Area of ∆ADC
= 180 cm2 + 126 cm2
= 306 cm2
Topic Terminology
Term
Table:
.
Test Your Learning

Mind Map Overal Idea Content Speed Notes Quick Coverage Graphical presentation of data is easier to understand. A bar graph is used to show comparison among categories. A pie graph is used to compare parts of a whole. A Histogram is a bar graph that shows data in intervals. (Scroll down till end of the… readmore
Overal Idea
Content
Quick Coverage
Graphical presentation of data is easier to understand.
A bar graph is used to show comparison among categories.
A pie graph is used to compare parts of a whole.
A Histogram is a bar graph that shows data in intervals. (Scroll down till end of the page)
Audio, Visual & Digital Content
Introduction to Graphs
A line graph displays data that changes continuously over periods of time. A line graph which is a whole unbroken line is called a linear graph.
For fixing a point on the graph sheet we need, x-coordinate and y-coordinate.
The relation between dependent variable and
through a graph.
independent variable is shown
A Bar Graph: A pictorial representation of numerical data in the form of bars (rectangles) of uniform width with equal spacing. The length (or height) of each bar
represents the given number.
A Pie Graph: A pie graph is used to compare parts of a whole. The various
observations or components are represented by the sectors of the circle.


A Histogram: Histogram is a type of bar diagram, where the class intervals are shown on the horizontal axis and the heights of the bars (rectangles) show the frequency of the class interval, but there is no gap between the bars as there is no gap between the
class intervals.
Linear Graph: A line graph in which all the line segments form a part of a single line. Coordinates: A point in Cartesian plane is represented by an ordered pair of numbers.
Ordered Pair: A pair of numbers written in specified order.

Topic Terminology
Term
Table:
.
Test Your Learning
Assign | Assess | Analyse
Objective Assessment
List Of Questions With Key, Aswers & Solutions
Back To Learn
Go Back To Learn Again
Assign | Assess | Analyse
Objective Assessment
List Of Questions With Key, Aswers & Solutions
Back To Learn
Go Back To Learn Again
Mind Map Overal Idea Content Speed Notes Quick Coverage Elements are classified as metals and non-metals based on different properties. The properties of metals and non-metals are given in the form of table below- Metals Non-metals Metals are lustrous, that is, they have a property to shine. They are not lustrous, that is, they do… readmore
Overal Idea
Content
Quick Coverage
Elements are classified as metals and non-metals based on different properties. The properties of metals and non-metals are given in the form of table below-
| Metals | Non-metals |
| Metals are lustrous, that is, they have a property to shine. | They are not lustrous, that is, they do not have shining surface. except, graphite and iodine |
| All metals exist as solids except mercury which is liquid at room temperature. | They are generally soft, except diamond. |
| They can be drawn into wires, this is known as Ductility. | They are non-ductile. |
| Metals can be converted into sheets, this is known as Malleability, except mercury | They are non-malleable |
| They are good conductors of electricity and heat. Except Lead and mercury. | They are poor conductors of electricity and heat. Exception-graphite is good conductor of electricity |
| They have high density and high melting point. Exception-sodium and potassium have low melting points | They have low density compared to metals and low melting point except Diamond which has high melting point |
Audio, Visual & Digital Content
Elements are classified as metals and non-metals based on different properties. The properties of metals and non-metals are given in the form of table below-
| Metals | Non-metals |
| Metals are lustrous, that is, they have a property to shine. | They are not lustrous, that is, they do not have shining surface. except, graphite and iodine |
| All metals exist as solids except mercury which is liquid at room temperature. | They are generally soft, except diamond. |
| They can be drawn into wires, this is known as Ductility. | They are non-ductile. |
| Metals can be converted into sheets, this is known as Malleability, except mercury | They are non-malleable |
| They are good conductors of electricity and heat. Except Lead and mercury. | They are poor conductors of electricity and heat. Exception-graphite is good conductor of electricity |
| They have high density and high melting point. Exception-sodium and potassium have low melting points | They have low density compared to metals and low melting point except Diamond which has high melting point |
For Example, Copper reacts with oxygen to form copper oxide.
Metal + O2 → Metal oxide
2Cu + O2 → 2CuO
4Al + 3O2 → 2Al2O3
Al2O3 + 6HCl → 2AlCl3 + H2O

2Na + 2H2O → 2NaOH + 1H2
2Al + 3H2O → Al2O3 + 3H2
Metal + Acid → Metal Salt + Hydrogen
Mg + 2HCl → MgCl2 + H2
Non-metal + Oxygen → Non-metal oxide
C + O2 → CO2
2 NaBr (aq) + Cl2(aq) → 2NaCl (aq) + Br2 (aq)
H2(g) + S(l) → H2S(g)
The series in which metals are arranged in the decreasing order of reactivity, it is known as Reactivity Series.

Fig.1. Reactivity Series
Compounds formed due to the transfer of electrons from a metal to a non-metal are known as Ionic Compounds.

Bond formed by sharing of electrons between the two atoms. They share their valence electrons to gain stability.

Elements or compounds which occur naturally in earth crust are known as Minerals. Minerals from which pure metals can be extracted are known as Mineral Ores.

Extraction of pure metals from its ores/steps for extraction of metals from its ore
Gangue – Ores contain different impurities in it such as sand, soil etc. These impurities are known as Gangue.
Extracting Metals which are low in activity series
Metals which are low in activity series are unreactive. The oxides of such metals can be reduced to metals by heating alone. For Example, Cinnabar (HgS)

Extracting Metals in the middle of the Activity Series
These metals are moderately reactive. They exists as sulphides or carbonates in nature. Before reduction, metal sulphides and carbonates must be converted into metal oxides. Sulphide ores are converted into oxides by heating strongly in presence of excess air, this is known as Roasting. Carbonate ores are converted into oxides by heating in limited air. This is known as Calcination.
Roasting

Calcination

Reduction-metal oxides can be reduced to metals using reducing agent such as such as Carbon.
Extracting metals towards the top of the activity series
The metals are highly reactive. They cannot be obtained by heating. For Example, Sodium, magnesium and calcium are obtained by the electrolysis of their molten chlorides.
At cathode Na+ + e– → Na
At anode 2Cl– → Cl2 + 2e–
Refining of impure metal is done using electrolytic refining. Impure copper is used as anode and strip of pure copper is used as Cathode. Acidified copper sulphate is used as electrolyte. When electric current is passed through this, impure metal from the anode gets deposited in the electrolyte solution, whereas pure metal from the electrolyte is deposited at cathode.
Deposition of insoluble residue formed from the dissolution of anode during commercial electrolysis.

Electrolytic refining
Metals when exposed to moist air for a long period of time, they become corroded. This is known as Corrosion. For Example, Silver reacts with moist air and becomes black in colour due to silver sulphide coating.
Iron + oxygen → Iron (III) oxide
Fe + O 2 → Fe2O3
Mixture of two or more metals or metal and non-metal is known as Alloy. For Example,
Topic Terminology
Term:
Topic Terminology
Term:
Test Your Learning
Assign | Assess | Analyse
Objective Assessment
List Of Questions With Key, Aswers & Solutions
Back To Learn
Go Back To Learn Again
Assign | Assess | Analyse
Objective Assessment
List Of Questions With Key, Aswers & Solutions
Back To Learn
Go Back To Learn Again
Assign | Assess | Analyse
Objective Assessment
List Of Questions With Key, Aswers & Solutions
Back To Learn
Go Back To Learn Again