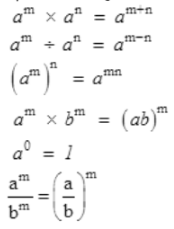
A statement of equality of two algebraic expressions involving one or more variables. Example: x + 2 = 3
Linear Equation in One variable: The expressions which form the equation that contain single variable and the highest power of the variable in the equation is one. (Scroll down to continue …)
Study Tools
Audio, Visual & Digital Content
Linear Equations in One Variable
An algebraic equation is an equality involving variables. It says that the value of the expression on one side of the equality sign is equal to the value of the expression on the other side.
The equations we study in Classes VI, VII and VIII are linear equations in one variable. In such equations, the expressions which form the equation contain only one variable. Further, the equations are linear, i.e., the highest power of the variable appearing in the equation is 1.
A linear equation may have for its solution any rational number.
An equation may have linear expressions on both sides. Equations that we studied in Classes VI and VII had just a number on one side of the equation.
Just as numbers, variables can, also, be transposed from one side of the equation to the other.
Occasionally, the expressions forming equations have to be simplified before we can solve them by usual methods. Some equations may not even be linear to begin with, but they can be brought to a linear form by multiplying both sides of the equation by a suitable expression.
The utility of linear equations is in their diverse applications; different problems on numbers, ages, perimeters, combination of currency notes, and so on can be solved
using linear equations.
Hindi Version
Dig Deep
Topic Level Resources
Sub – Topics
Select A Topic
Topic:
Chapters Index
Select Another Chapter
[display-posts category=”CBSE 8 – Mathematics – Study – Premium” posts_per_page=”25″]
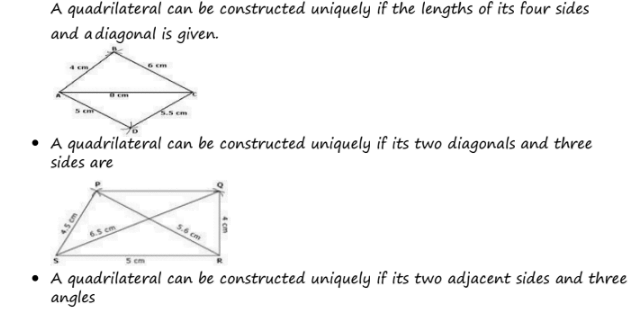
A quadrilateral has 10 parts – 4 sides, 4 angles and 2 diagonals. Five measurements can determine a quadrilateral uniquely. (Scroll down to continue …)
Study Tools
Audio, Visual & Digital Content
Practical Geometry
Five measurements can determine a quadrilateral uniquely.
A quadrilateral can be constructed uniquely if the lengths of its four sides and a diagonal is given.
A quadrilateral can be constructed uniquely if its two diagonals and three sides are
known.
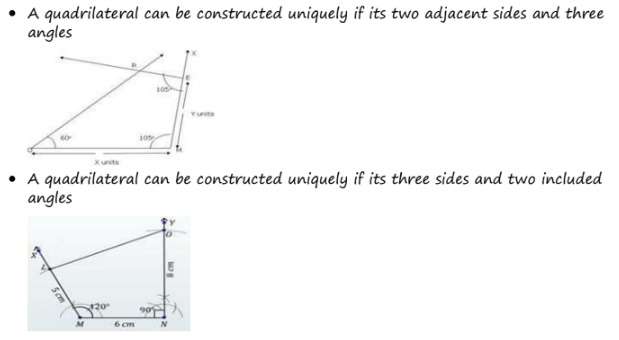
A quadrilateral can be constructed uniquely if its two adjacent sides and three angles
are known.
A quadrilateral can be constructed uniquely if its three sides and two included angles
are given.
Hindi Version
Dig Deep
Topic Level Resources
Sub – Topics
Select A Topic
Topic:
Chapters Index
Select Another Chapter
[display-posts category=”CBSE 8 – Mathematics – Study – Premium” posts_per_page=”25″]
Data Handling: Deals with the process of collecting data, presenting it and getting result.
Data mostly available to us in an unorganised form is called raw data. (Scroll down to continue …)
Study Tools
Audio, Visual & Digital Content
Grouped data can be presented using histogram. Histogram is a type of bar diagram, where the class intervals are shown on the horizontal axis and the heights of the bars show the frequency of the class interval. Also, there is no gap between the bars as there is no gap between the class intervals.
In order to draw meaningful inferences from any data, we need to organise the data systematically.
Frequency gives the number of times that a particular entry occurs.
Raw data can be ‘grouped’ and presented systematically through ‘grouped frequency distribution’.
Statistics: The science which deals with the collection, presentation, analysis and interpretation of numerical data.
Observation: Each entry (number) in raw data.
Range: The difference between the lowest and the highest observation in a given data.
Array: Arranging raw data in ascending or descending order of magnitude. Data can also presented using circle graph or pie chart. A circle graph shows the relationship between a whole and its part.
There are certain experiments whose outcomes have an equal chance of occurring. A random experiment is one whose outcome cannot be predicted exactly in advance. Outcomes of an experiment are equally likely if each has the same chance of occurring.
Frequency: The number of times a particular observation occurs in the given data.
Class Interval: A group in which the raw data is condensed.
(i) Continuous: The upper limit of a class interval coincides with the lower limit of the next class.
Hindi Version
Dig Deep
Topic Level Resources
Sub – Topics
Select A Topic
Topic:
Chapters Index
Select Another Chapter
[display-posts category=”CBSE 8 – Mathematics – Study – Premium” posts_per_page=”25″]
Square: Number obtained when a number is multiplied by itself. It is the number raised to the power 2. 22 = 2 x 2=4(square of 2 is 4).
If a natural number m can be expressed as n2, where n is also a natural number, then m is a square number.(Scroll down to continue …)
Study Tools
Audio, Visual & Digital Content
All square numbers end with 0, 1, 4, 5, 6 or 9 at unit’s place. Square numbers can only have even number of zeros at the end. Square root is the inverse operation of square.
There are two integral square roots of a perfect square number.
Positive square root of a number is denoted by the symbol For example, 32=9 gives
Perfect Square or Square number: It is the square of some natural number. If m=n2, then m is a perfect square number where m and n are natural numbers. Example: 1=1 x 1=12, 4=2 x 2=22.
Properties of Square number:
A number ending in 2, 3, 7 or 8 is never a perfect square. Example: 152, 1028, 6593 etc.
A number ending in 0, 1, 4, 5, 6 or 9 may not necessarily be a square number. Example: 20, 31, 24, etc.
Square of even numbers are even. Example: 22 = 4, 42=16 etc.
Square of odd numbers are odd. Example: 52 = 25, 92 = 81, etc.
A number ending in an odd number of zeroes cannot be a perferct square. Example: 10, 1000, 900000, etc.
The difference of squares of two consecutive natural number is equal to their sum. (n + 1)2– n2 = n+1+n. Example: 42 – 32 =4 + 3=7. 122– 112 =12+11 =23, etc.
A triplet (m, n, p) of three natural numbers m, n and p is called Pythagorean
triplet, if m2 + n2 = p2: 32 + 42 = 25 = 52
Hindi Version
Dig Deep
Topic Level Resources
Sub – Topics
Select A Topic
Topic:
Chapters Index
Select Another Chapter
[display-posts category=”CBSE 8 – Mathematics – Study – Premium” posts_per_page=”25″]
Cube number: Number obtained when a number is multiplied by itself three times. 23 = 2 x 2 x 2 = 8, 33 = 3 x 3 x 3=27, etc.
Numbers like 1729, 4104, 13832, are known as Hardy – Ramanujan Numbers. They
can be expressed as sum of two cubes in two different ways.
Study Tools
Audio, Visual & Digital Content
Numbers obtained when a number is multiplied by itself three times are known as cube numbers. For example 1, 8, 27, … etc.
If in the prime factorisation of any number each factor appears three times, then the
number is a perfect cube.
The symbol
denotes cube root. For example
Perfect Cube: A natural number is said to be a perfect cube if it is the cube of some natural number. Example: 8 is perfect cube, because there is a natural number 2 such that 8 = 23, but 18 is not a perfect cube, because there is no natural number whose cube is 18.
The cube of a negative number is always negative.
Properties of Cube of Number:
Cubes of even number are even.
Cubes of odd numbers are odd.
The sum of the cubes of first n natural numbers is equal to the square of their sum.
Cubes of the numbers ending with the digits 0, 1, 4, 5, 6 and 9 end with digits 0, 1, 4, 5, 6 and 9 respectively.
Cube of the number ending in 2 ends in 8 and cube of the number ending in 8 ends in 2.
Cube of the number ending in 3 ends in 7 and cube of the number ending in 7
ends in 3.
Hindi Version
Dig Deep
Topic Level Resources
Sub – Topics
Select A Topic
Topic:
Chapters Index
Select Another Chapter
[display-posts category=”CBSE 8 – Mathematics – Study – Premium” posts_per_page=”25″]
Ratio: Comparing by division is called ratio. Quantities written in ratio have the sameunit. Ratio has no unit. (Scroll down to continue …)
Study Tools
Audio, Visual & Digital Content
Equality of two ratios is called proportion. Product of extremes = Product of means Percentage: Percentage means for every hundred. The result of any division in whichthe divisor is 100 is a percentage. The divisor is denoted by a special symbol %, read as percent. Profit and Loss: (i) Cost Price (CP): The amount for which an article is bought. (ii) Selling Price (SP): The amount for which an article is sold. Additional expenses made after buying an article are included in the cost price and are known as overhead expenses. These may include expenses like amount spent onrepairs, labour charges, transportation, etc. Discount is a reduction given on marked price. Discount = Marked Price – Sale Price. Discount can be calculated when discount percentage is given. Discount
Hindi Version
Dig Deep
Topic Level Resources
Sub – Topics
Select A Topic
Topic:
Chapters Index
Select Another Chapter
[display-posts category=”CBSE 8 – Mathematics – Study – Premium” posts_per_page=”25″]
Algebraic Expressions and Identities | Speed Notes
Notes For Quick Recap
Expressions are formed from variables and constants.
Constant: A symbol having a fixed numerical value.
Example: 2,, 2.1, etc. (Scroll down to continue …)
Study Tools
Audio, Visual & Digital Content
Variable: A symbol which takes various numerical values. Example: x, y, z, etc.
Algebric Expression: A combination of constants and variables connected by the sign
+, -, and is called algebraic expression.
Terms are added to form expressions.
Terms themselves are formed as product of factors.
Expressions that contain exactly one, two and three terms are called monomials, binomials and trinomials respectively.
In general, any expression containing one or more terms with non-zero coefficients (and with variables having non- negative exponents) is called a polynomial.
Like terms are formed from the same variables and the powers of these variables are the same, too.
Coefficients of like terms need not be the same.
While adding (or subtracting) polynomials, first look for like terms and add (or subtract) them; then handle the unlike terms.
There are number of situations in which we need to multiply algebraic expressions: for example, in finding area of a rectangle, the sides of which are given as expressions.
Monomial: An expression containing only one term. Example: -3, 4x, 3xy, etc.
Binomial: An expression containing two terms. Example: 2x-3, 4x+3y, xy-4, etc.,
Polynomial: In general, any expression containing one or more terms with non-zero coefficients (and with variables having non-negative exponents).
A polynomial may contain any number of terms, one or more than one.
A monomial multiplied by a monomial always gives a monomial.
Multiplication of a Polynomial and a monomial:
While multiplying a polynomial by a monomial, we multiply every term in the polynomial by the mononomial.
Trinomial: An expression containing three terms.
Example:
3x+2y+5z, etc.
In carrying out the multiplication of a polynomial by a binomial (or trinomial), we multiply term by term, i.e., every term of the polynomial is multiplied by every term in the binomial (or trinomial).
Note that in such multiplication, we may get terms in the product which are like and have to be combined.
An identity is an equality, which is true for all values of the variables in the equality.
On the other hand, an equation is true only for certain values of its variables.
An equation is not an identity.
The following are the standard identities:
(a + b)2 = a2 + 2ab + b2
(a – b)2 = a2 – 2ab +b2
(a + b)(a – b) = a2 – b2
(x + a) (x + b) = x2 + (a + b) x + ab
The above four identities are useful in carrying out squares and products of algebraic expressions.
They also allow easy alternative methods to calculate products of numbers and so on.
Coefficients: In the term of an expression any of the factors with the sign of the term is called the coefficient of the product of the other factors.
Terms: Various parts of an algebraic expression which are separated by + and – signs. Example: The expression 4x + 5 has two terms 4x and 5.
Constant Term: A term of expression having no lateral factor.
Like term: The term having the same literal factors. Example 2xy and -4xy are like terms.
(iii) Unlike term: The terms having different literal factors.
Example:
are unlike terms.
and 3xy
Factors: Each term in an algebraic expression is a product of one or more number (s) and/or literals. These number (s) and/or literal (s) are known as the factor of that term. A constant factor is called numerical factor, while a variable factor is known as
a literal factor. The term 4x is the product of its factors 4 and x.
Hindi Version
Dig Deep
Topic Level Resources
Sub – Topics
Select A Topic
Topic:
Chapters Index
Select Another Chapter
[display-posts category=”CBSE 8 – Mathematics – Study – Premium” posts_per_page=”25″]
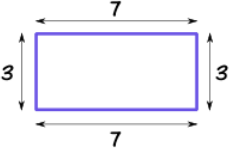
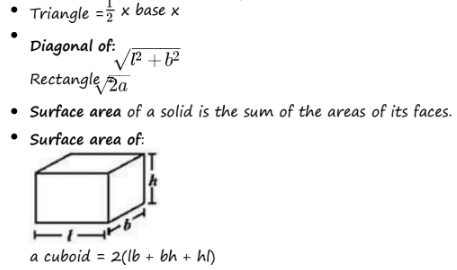
Perimeter: Length of boundary of a simple closed figure.
Perimeter of Rectangle = 2(l +b) Perimeter of Square = 4a Perimeter of Parallelogram = 2(sum of two adjacent sides) Area: The measure of region enclosed in a simple closed figure.
Area of a trapezium = half of the sum of the lengths of parallel sides × perpendiculardistance between them.
Area of a rhombus = half the product of its diagonals. (Scroll down to continue …)
Study Tools
Audio, Visual & Digital Content
Hindi Version
Dig Deep
Topic Level Resources
Sub – Topics
Select A Topic
Topic:
Chapters Index
Select Another Chapter
[display-posts category=”CBSE 8 – Mathematics – Study – Premium” posts_per_page=”25″]
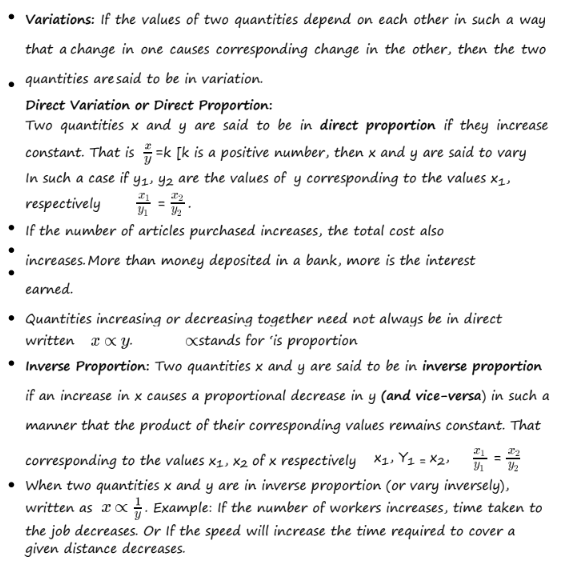
Variations: If the values of two quantities depend on each other in such a way that a change in one causes corresponding change in the other, then the two quantities are said to be in variation. (Scroll down to continue …)
Study Tools
Audio, Visual & Digital Content
Direct Variation or Direct Proportion:
Extra:
Two quantities x and y are said to be in direct proportion if they increase (decrease) together in such a manner that the ratio of their corresponding values remains
constant. That is if
=k [k is a positive number, then x and y are said to vary directly.
In such a case if y1, y2 are the values of y corresponding to the values x1, x of x
respectively then = .
If the number of articles purchased increases, the total cost also increases. More than money deposited in a bank, more is the interest earned.
Quantities increasing or decreasing together need not always be in direct proportion, same in the case of inverse proportion.
When two quantities x and y are in direct proportion (or vary directly), they are
written as
. Symbol
stands for ‘is proportion to’.
Inverse Proportion: Two quantities x and y are said to be in inverse proportion if an increase in x causes a proportional decrease in y (and vice-versa) in such a manner that the product of their corresponding values remains constant. That is, if xy
= k, then x and y are said to vary inversely. In this case if y1, y2 are the values of y
corresponding to the values x1, x2 of x respectively then
x1, Y1 = x2, y2 or
=
When two quantities x and y are in inverse proportion (or vary inversely), they are
written as x
. Example: If the number of workers increases, time taken to finish
the job decreases. Or If the speed will increase the time required to cover a given distance decreases.
1. Distance and Time
Time (hours)
Distance (km)
Formula
0
0
⇒ d=60×t
1
60
2
120
3
180
2. Cost of Groceries
Number of Apples
Total Cost ($)
Formula
0
0
C=2n
1
2
2
4
5
10
3.Cooking Ingredients
Number of Servings
Amount of Flour (cups)
Formula
0
0
F=0.5s
4
2
6
3
8
4
4. Speed and Fuel Consumption
Distance (km)
Fuel Consumed (liters)
Formula
0
0
F=15d
15
1
30
2
45
3
5. Salary and Hours Worked
Hours Worked
Total Earnings ($)
Formula
0
0
E=15h
1
15
5
75
10
150
Hindi Version
Dig Deep
Topic Level Resources
Sub – Topics
Select A Topic
Topic:
Chapters Index
Select Another Chapter
[display-posts category=”CBSE 8 – Mathematics – Study – Premium” posts_per_page=”25″]
Factorisation: Representation of an algebraic expression as the product of two or more expressions is called factorization. Each such expression is called a factor of the given algebraic expression. (Scroll down to continue …)
Study Tools
Audio, Visual & Digital Content
When we factorise an expression, we write it as a product of factors. These factors may be numbers, algebraic variables or algebraic expressions.
An irreducible factor is a factor which cannot be expressed further as a product of factors.
A systematic way of factorising an expression is the common factor method. It consists of three steps:
Write each term of the expression as a product of irreducible factors
Look for and separate the common factors and
Combine the remaining factors in each term in accordance with the distributive law.
Sometimes, all the terms in a given expression do not have a common factor; but the terms can be grouped in such a way that all the terms in each group have a common factor. When we do this, there emerges a common factor across all the groups leading to the required factorisation of the expression. This is the method of regrouping.
In factorisation by regrouping, we should remember that any regrouping (i.e., rearrangement) of the terms in the given expression may not lead to factorisation. We must observe the expression and come out with the desired regrouping by trial and error.
A number of expressions to be factorised are of the form or can be put into the form: a2 + 2ab + b2, a2 – 2ab + b2, a2 – b2 and x2 + (a + b)x + ab. These expressions can be easily factorised using Identities I, II, III and IV
a2 + 2ab + b2 = (a + b)2
a2 – 2ab + b2 = (a – b)2
a2 – b2 = (a + b) (a – b)
Factorisation
x2 + (a + b)x + ab = (x + a)(x + b)
In expressions which have factors of the type (x + a) (x + b), remember the numerical term gives ab.
Its factors, a and b, should be so chosen that their sum, with signs taken care of, is the coefficient of x.
We know that in the case of numbers, division is the inverse of multiplication. This idea is applicable also to the division of algebraic expressions.
In the case of division of a polynomial by a monomial, we may carry out the division either by dividing each term of the polynomial by the monomial or by the common factor method.
In the case of division of a polynomial by a polynomial, we cannot proceed by dividing each term in the dividend polynomial by the divisor polynomial. Instead, we factorise both the polynomials and cancel their common factors.
In the case of divisions of algebraic expressions that we studied in this chapter, we have Dividend = Divisor × Quotient.
In general, however, the relation is Dividend = Divisor × Quotient + Remainder
Thus, we have considered in the present chapter only those divisions in which the remainder is zero.
There are many errors students commonly make when solving algebra exercises.
You should avoid making such errors.
Hindi Version
Dig Deep
Topic Level Resources
Sub – Topics
Select A Topic
Topic:
Chapters Index
Select Another Chapter
[display-posts category=”CBSE 8 – Mathematics – Study – Premium” posts_per_page=”25″]
Graphical presentation of data is easier to understand.
A bar graph is used to show comparison among categories.
A pie graph is used to compare parts of a whole.
A Histogram is a bar graph that shows data in intervals. (Scrol down to continue …)
Study Tools
Audio, Visual & Digital Content
Introduction to Graphs
A line graph displays data that changes continuously over periods of time. A line graph which is a whole unbroken line is called a linear graph.
For fixing a point on the graph sheet we need, x-coordinate and y-coordinate.
The relation between dependent variable and
through a graph.
independent variable is shown
A Bar Graph: A pictorial representation of numerical data in the form of bars (rectangles) of uniform width with equal spacing. The length (or height) of each bar
represents the given number.
A Pie Graph: A pie graph is used to compare parts of a whole. The various
observations or components are represented by the sectors of the circle.
A Histogram: Histogram is a type of bar diagram, where the class intervals are shown on the horizontal axis and the heights of the bars (rectangles) show the frequency of the class interval, but there is no gap between the bars as there is no gap between the
class intervals.
Linear Graph: A line graph in which all the line segments form a part of a single line. Coordinates: A point in Cartesian plane is represented by an ordered pair of numbers.
Ordered Pair: A pair of numbers written in specified order.
Hindi Version
Dig Deep
Topic Level Resources
Sub – Topics
Select A Topic
Topic:
Chapters Index
Select Another Chapter
[display-posts category=”CBSE 8 – Mathematics – Study – Premium” posts_per_page=”25″]
[display-posts posts_per_page=”15″ tag=”CBSE, Class 9, Mathematics, Study, Premium”]
Watch In English & Hindi
Speed Notes
Notes For Quick Recap
Write An Article On Chandrayaan 3 with SEO For www.therightmentor.com
Chandrayaan 3: India’s Next Mission to the Moon
India is all set to launch its third lunar mission, Chandrayaan 3, in the near future. The Indian Space Research Organisation (ISRO) has been working tirelessly on this project since the success of Chandrayaan 2 in September 2019. This mission is expected to be a major milestone in India’s space exploration journey, and it has generated a lot of interest and excitement among space enthusiasts.
What is Chandrayaan 3?
Chandrayaan 3 is India’s third lunar mission, which aims to land a rover on the moon’s surface. The mission is a follow-up to Chandrayaan 2, which was partially successful. The main objective of Chandrayaan 3 is to conduct scientific experiments and collect data on the moon’s surface and atmosphere. The mission will also help India to develop its technological capabilities in space exploration.
What are the key features of Chandrayaan 3?
Chandrayaan 3 will consist of an orbiter, a lander, and a rover. The orbiter will be responsible for mapping the moon’s surface, while the lander will carry the rover to the moon’s surface. The rover will then explore the moon’s surface, collect data, and conduct experiments. Chandrayaan 3 will also carry a range of scientific instruments that will help in studying the moon’s geology, mineralogy, and atmosphere.
What are the challenges of Chandrayaan 3?
Chandrayaan 3 is a complex mission that involves several challenges. One of the biggest challenges is the landing of the rover on the moon’s surface. The lander has to be designed in such a way that it can withstand the harsh lunar environment and land safely on the moon’s surface. Another challenge is the communication between the lander and the orbiter. The lander has to communicate with the orbiter in order to transmit data back to Earth.
When will Chandrayaan 3 be launched?
The launch date for Chandrayaan 3 has not been announced yet. However, ISRO has stated that it is working towards launching the mission as soon as possible. The COVID-19 pandemic has delayed the mission’s progress, but ISRO is confident that it will be able to launch Chandrayaan 3 in the near future.
Conclusion
Chandrayaan 3 is an important mission for India’s space exploration journey. It will help India to develop its technological capabilities in space exploration and contribute to scientific research on the moon’s surface and atmosphere. The success of Chandrayaan 3 will be a major milestone for India and will inspire future generations of space enthusiasts.
Statistics is the study of collection, organization, analysis and interpretation of data.
Data
Data is a distinct piece of information in the form of fact or figures collected or represented for any specific purpose. The word data is derived from the Latin word Datum.
Collection of Data
In general, data is of two types. They are:
Primary Data
Secondary Data
Primary Data
Primary data is the data collected from any firsthand experience for an explicit use or purpose.
Secondary data
Secondary data is the data collected by any third party for a different purpose other than the user.
Presentation of Data
After collecting data it is important to present it meaningfully. There are many ways to present data.
1. Raw Data or Ungrouped Data
a. Raw Data or Ungrouped Data is the collected data without any change in its form.
Example
The marks obtained by 10 students in a Mathematics test are:
55 36 95 73 60 42 25 78 75 62
Range
Range is the difference between the highest and the lowest values of data.
For Above data: Range = 95 – 36 = 59
b. Frequency Distribution Table – Frequency Distribution Table is the data of a large number of items converted into tabular form.
Frequency is the number of times the item comes to the table.
2. Grouped Data
To present the very large number of items in the data we use a grouped distribution table.
Grouped Distribution Table
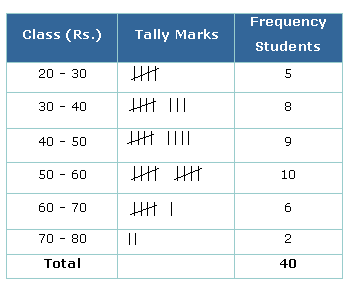
a. Class Interval – The group used to classify the data is called the class interval i.e. 20 – 30, 30 – 40.
b. Upper Limit – In each class interval, the greatest number is the upper-class limit.
c. Lower Limit – In each class interval, the smallest number is the lower class limit.
d. Class Size – It is the difference between the upper limit and the lower limit i.e. 10.
Class Size = Upper Limit – Lower Limit
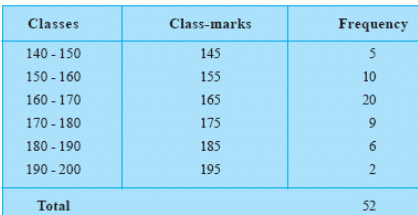
e. Class Mark – The midpoint of each class interval is the class mark.
Grouped data could be of two types as below:-
Inclusive or discontinuous Frequency Distribution.
Exclusive or continuous Frequency Distribution
Inclusive or discontinuous Frequency Distribution – If the upper limit of a class is different from the lower limit of its next class then it is said to be an Inclusive or discontinuous Frequency Distribution.
Example
Draw the histogram of the following frequency distribution.
Daily earnings (in Rs)
700 – 749
750 – 799
800 – 849
850 – 899
900 – 949
950 – 999
No. of stores
6
9
2
7
11
5
Exclusive or continuous Frequency Distribution – If the upper limit of a class is the same as the lower limit of its next class then it is said to be exclusive or continuous Frequency Distribution
Example
Draw the histogram of the following frequency distribution.
Daily earnings (in Rs)
700 – 750
750 – 800
800 – 850
850 – 900
900 – 950
950 – 1000
No. of stores
6
9
2
7
11
5
Graphical Representation of Data
Since a picture represents better than a thousand words, The data is presented graphically. Some of the methods of representing the data graphically are:
1. Bar Graph
2. Histogram
3. Frequency Polygon
1. Bar Graph
It is the easiest way to represent the data in the form of rectangular bars so it is called Bar graph.
The thickness of each bar should be the same.
The space between the bars should also be the same.
The height of the bar should be according to the numerical data to be represented.
Example
Represent the average monthly rainfall of Nepal for the first six months in the year 2014.
Month
Jan
Feb
Mar
Apr
May
Jun
Average rainfall
45
65
40
60
75
30
Solution
On the x-axis mark the name of the months.
On the y-axis mark the class interval which we have chosen.
Then mark the average rainfall respective to the name of the month by the vertical bars.
The bars could be of any width but should be the same.
This is the required bar graph.
2. Histogram
It is similar to Bar graph, but it is used in case of a continuous class interval.
The class intervals are to be taken along an x-axis.
The height represents the frequencies of the respective class intervals.
Example
Draw the histogram of the following frequency distribution.
Daily earnings (in Rs)
700 – 750
750 – 800
800 – 850
850 – 900
900 – 950
950 – 1000
No. of stores
6
9
2
7
11
5
Solution:
Mark the daily earnings on the x-axis.
Mark the no. of stores on the y-axis.
As the scale is starting from 700 so we will mark the zigzag to show the break.
Mark the daily earnings through the vertical bars.
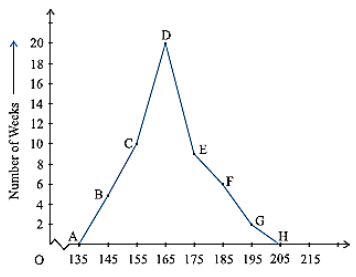
3. Frequency Polygon
Procedure to draw the frequency polygon
First, we need to draw a histogram.
Then join the midpoint of the top of the bars to a line segment and the figure so obtained is the required frequency polygon.
The midpoint of the first bar is to be joined with the midpoint of the imaginary interval of the x-axis
The midpoint of the last bar is to be joined with the midpoint of the next interval of the x-axis.
If we need to draw the frequency polygon without drawing the histogram then first we need to calculate the class mark of each interval and these points will make the frequency polygon.
Example
Draw the frequency polygon of a city in which the following weekly observations were made in a study on the cost of living index without histogram.
Step 1: First of all we need to calculate the class mark of each class interval.
Step 2: Take the suitable scale and represent the class marks on the x-axis.
Step 3: Take the suitable scale and represent the frequency distribution on the y-axis.
Step 4: To complete the frequency polygon we will join it with the x-axis before the first class and after the last interval.
Step 5: Now plot the respective points and join to make the frequency polygon.
Measures of Central Tendency
To make all the study of data useful, we need to use measures of central tendencies. Some of the tendencies are
1. Mean
2. Median
3. Mode
1. Mean (Average)
The mean is the average of the number of observations. It is calculated by dividing the sum of the values of the observations by the total number of observations.
It is represented by x bar or.
The meanof n values x1, x2, x3, …… xn is given by
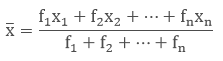
Mean of Grouped Data (Without Class Interval)
If the data is organized in such a way that the frequency is given but there is no class interval then we can calculate the mean by
where, x1, x2, x3,…… xn are the observations
f1, f2, f3, …… fn are the respective frequencies of the given observations.
Example
Here, x1, x2, x3, x4, and x5 are 20, 40, 60, 80,100 respectively.
and f1 , f2 , f3 , f4, f5 are 40, 60, 30, 50, 20 respectively.
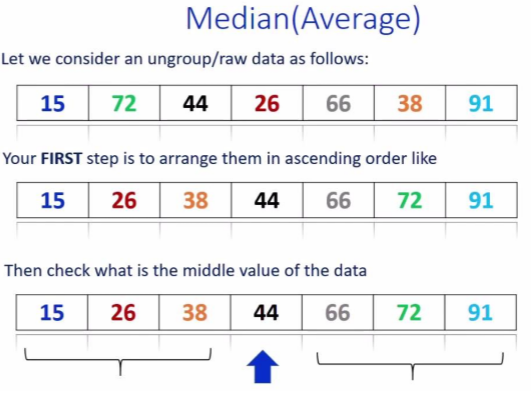
2. Median
The median is the middle value of the given number of the observation which divides into exactly two parts.
For median of ungrouped data, we arrange it in ascending order and then calculated as follows
If the number of the observations is odd then the median will be Term
As in the above figure the no. of observations is 7 i.e. odd, so the median will beterm.
= 4th term.
The fourth term is 44.
If the number of observations is even then the median is the average of n/2 and (n/2) +1 term.
Example
Find the median of the following data.
6, 7, 10, 12, 13, 4, 8, 12
1. First, we need to arrange it in ascending order.
4, 6, 7,8,10,12,12,13
2. The no. of observation is 8. As the no. of observation is even the median is the average of n/2 and (n/2)+1.
3.
4. 4th term is 8 and the 5th term is 10.
5. So the median
3. Mode
The mode is the value of the observation which shows the number that occurs frequently in data i.e. the number of observations which has the maximum frequency is known as the Mode.
Example
Find the Mode of the following data:
15, 20, 22, 25, 30, 20,15, 20,12, 20
Solution
Here the number 20 appears the maximum number of times so
Mode = 20.
Remark: The empirical relation between the three measures of central tendency is: 3 Median = Mode + 2 Mean
The figures which we can be drawn on a flat surface or that lie on a plane are called Plane Figure.
Example – Circle, Square, Rectangle etc.
Solid figures
The 3D shapes which occupy some space are called Solid Figures.
Example – Cube, Cuboid, Sphere etc. (Scroll down to continue …)
Study Tools
Audio, Visual & Digital Content
Volume
Space occupied by any solid shape is the capacity or volume of that figure. The unit of volume is a cubic unit.
Surface Area
The area of all the faces of the solid shape is its total surface area. The unit of surface area is a square unit.
Lateral or Curved Surface Area
The surface area of the solid shape after leaving the top and bottom face of the figure is called the lateral surface of the shape. The unit of lateral surface area is a square unit.
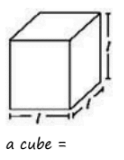
Surface Area and Volume of a Cube
Cube is a solid shape having 6 equal square faces.
Lateral surface area of a cube
4s2
Total surface area of a cube
6s2
The volume of a cube
s3
Diagonal
√3 s, s = edge of the cube = side length of face of cube
Surface Area and Volume of a Cube
Example
What is the capacity of a cubical vessel having each side of 8 cm?
Solution
Given side = 8 cm So, Volume of the cubical vessel = l3 = (8)3 = 256 cm3.
Surface Area and volume of a Cuboid
Cuboid is a solid shape having 6 rectangular faces at a right angle.
Lateral surface area of a cuboid
2h(l + b)
Total surface area of a cuboid
2(lb + bh + lh)
Volume of a cuboid
lbh
Diagonal
l = length, b = breadth, h = height
Surface Area and volume of a Cuboid
Example
What is the surface area of a cereal box whose length, breadth and height is 20 cm, 8 cm and 30 cm respectively?
Solution
Given, length = 20 cm, breadth = 8 cm, Height = 30 cm
Total surface area of the cereal box = 2(lb + bh + lh)
= 2(20 × 8 + 8 × 30 + 20 × 30)
= 2(160 + 240 + 600)
= 2(1000) = 2000 cm2.
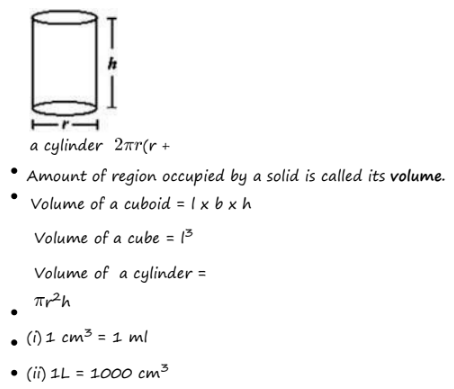
Surface Area and Volume of a Right Circular Cylinder
If we fold a rectangular sheet with one side as its axis then it forms a cylinder. It is the curved surface of the cylinder. And if this curved surface is covered by two parallel circular bases then it forms a right circular cylinder.
Curved surface area of a Right circular cylinder
2πrh
Total surface area of a Right circular cylinder
2πr2 + 2πrh = 2πr(r + h)
The volume of a Right circular cylinder
πr2h
r = radius, h = height
Surface Area and Volume of a Right Circular Cylinder
Surface Area and Volume of a Hollow Right Circular Cylinder
If a right circular cylinder is hollow from inside then it has different curved surface and volume.
Curved surface area of a Right circular cylinder
2πh (R + r)
Total surface area of a Right circular cylinder
2πh (R + r) + 2π(R2 – r2)
R = outer radius, r = inner radius, h = height
Surface Area and Volume of a Hollow Right Circular Cylinder
Example
Find the Total surface area of a hollow cylinder whose length is 22 cm and the external radius is 7 cm with 1 cm thickness. (π = 22/7)
Solution
Given, h = 22 cm, R = 7 cm, r = 6 cm (thickness of the wall is 1 cm).
Total surface area of a hollow cylinder = 2πh(R + r) + 2π(R2 – r2)
= 2(π) (22) (7+6) + 2(π)(72 – 62)
= 572 π + 26 π = 598 π
= 1878.67 cm2
Surface Area and Volume of a Right Circular Cone
If we revolve a right-angled triangle about one of its sides by taking other as its axis then the solid shape formed is known as a Right Circular Cone.
Curved surface area of a Right Circular Cone
πrl = πr[√(h2 + r2)]
Total surface area of a Right Circular Cone
πr2 + πrl = πr(r + l)
The volume of Right Circular Cone
(1/3) πr2h
r = radius, h = height, l = slant height
Surface Area and Volume of a Right Circular Cone
Surface Area and Volume of a Sphere
A sphere is a solid shape which is completely round like a ball. It has the same curved and total surface area.
Curved or Lateral surface area of a Sphere
4πr2
Total surface area of a Sphere
4πr2
Volume of a Sphere
(4/3) πr3
R = radius
Surface Area and Volume of a Sphere
Surface Area and Volume of a Hemisphere
If we cut the sphere in two parts then is said to be a hemisphere.
Curved or Lateral surface area of a Sphere
2πr2
Total surface area of a Sphere
3πr2
Volume of a Sphere
(2/3) πr3
r = radius
Surface Area and Volume of a Hemisphere
Example
If we have a metal piece of cone shape with volume 523.33 cm3 and we mould it in a sphere then what will be the surface area of that sphere?
There are many objects in our life which are round in shape. A few examples are the clock, dart board, cartwheel, ring, Vehicle wheel, Coins, etc. (Scroll down to continue …)
Study Tools
Audio, Visual & Digital Content
Circles
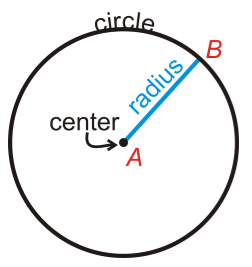
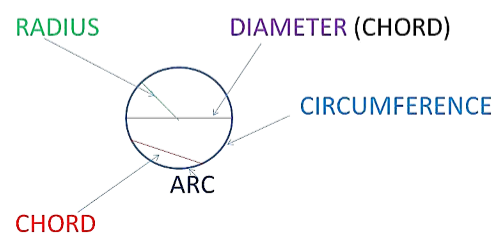
Any closed shape with all points connected at equidistant from the centre forms a Circle.
Any point which is equidistant from anywhere from its boundary is known as the Centre of the Circle.
Radius is a Latin word which means ‘ray’ but in the circle it is the line segment from the centre of the circle to its edge. So any line starting or ending at the centre of the circle and joining anywhere on the border of the circle is known as the Radius of Circle.
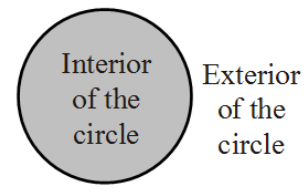
Interior and Exterior of a Circle
In a flat surface, the interior of a circle is the line whose distance from the centre is less than the radius.
The exterior of a circle is the line in the plane whose distance from the centre is larger than the radius.
Terms related to circle
Chord: Any straight line segment that’s both endpoints falls on the boundary of the circle is known as Chord. In Latin, it means ‘bowstring’.
Diameter: Any straight line segment or Chord which passes through the centre of the Circle and its endpoints connects on the boundary of the Circle is known as the Diameter of Circle. So in a circle Diameter is the longest chord possible in a circle.
Arc: Any smooth curve joining two points is known as Arc. So in Circle, we can have two possible Arcs, the bigger one is known as Major Arc and the smaller one is known as Minor Arc.
Circumference: It is the length of the circle if we open and straighten it out to make a line segment.
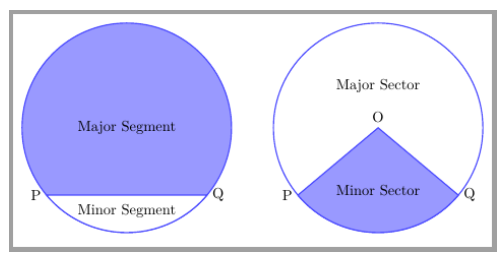
Segment and Sector of the Circle
A segment of the circle is the region between either of its arcs and a chord. It could be a major or minor segment.
Sector of the circle is the area covered by an arc and two radii joining the centre of the circle. It could be the major or minor sector.
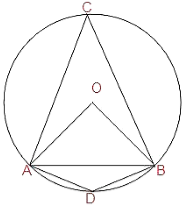
Angle Subtended by a Chord at a Point
If in a circle AB is the chord and is making ∠ACB at any point of the circle then this is the angle subtended by the chord AB at a point C.
Likewise, ∠AOB is the angle subtended by chord AB at point O i.e. at the centre and ∠ADB is also the angle subtended by AB at point D on the circle.
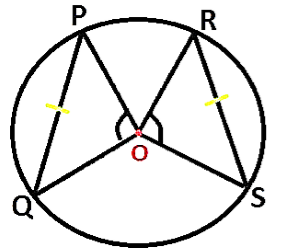
Theorem 1: Any two equal chords of a circle subtend equal angles at the centre.
Here in the circle, the two chords are given and PQ = RS with centre O.
So OP = OS = OQ = OR (all are radii of the circle)
∆POQ ≅ ∆SOR
∠POQ = ∠SOR
This shows that the angles subtended by equal chords to the centre are also equal.
Theorem 2: If the angles made by the chords of a circle at the centre are equal, then the chords must be equal.
This theorem is the reverse of the above Theorem 1.
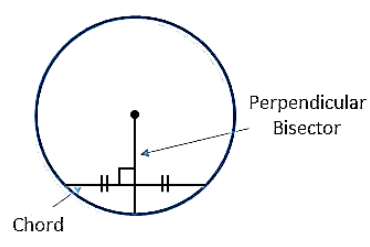
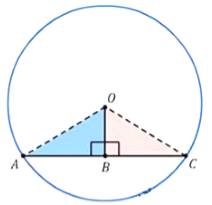
Perpendicular from the Centre to a Chord
Theorem 3: If we draw a perpendicular from the centre of a circle to any chord then it bisects the chord.
If we draw a perpendicular from the centre to the chord of the circle then it will bisect the chord. And the bisector will make a 90° angle to the chord.
Theorem 4: The line which is drawn from the centre of a circle to bisect a chord must be perpendicular to the chord.
If we draw a line OB from the centre of the circle O to the midpoint of the chord AC i.e. B, then OB is the perpendicular to the chord AB.
If we join OA and OC, then
In ∆OBA and ∆OBC,
AB = BC (B is the midpoint of AC)
OA = OC (Both are the radii of the same circle)
OB = OB (same side)
Hence, ΔOBA ≅ ΔOBC (both are congruent by SSS congruence rule)
⇒ ∠OBA = ∠OBC (respective angles of congruent triangles)
∠OBA + ∠OBC = ∠ABC = 180° [Linear pair]
∠OBC + ∠OBC = 180° [Since ∠OBA = ∠OBC]
2 x ∠OBC = 180°
∠OBC = 90o
∠OBC = ∠OBA = 90°
∴ OB ⊥ AC
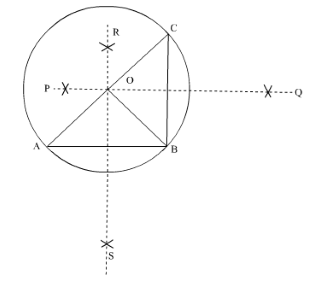
Circle through Three Points
Theorem 5: There is one and only one circle passing through three given non-collinear points.
In this figure, we have three non-collinear points A, B and C. Let us join AB and BC and then make the perpendicular bisector of both so that RS and PQ the perpendicular bisector of AB and BC respectively meet each other at Point O.
Now take the O as centre and OA as the radius to draw the circle which passes through the three points A, B and C.
This circle is known as Circumcircle. Its centre and radius are known as the Circumcenter and Circumradius.
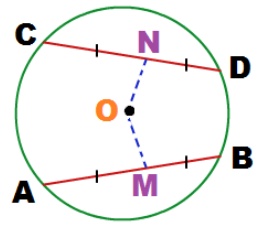
Equal Chords and Their Distances from the Centre
Theorem 6: Two equal chords of a circle are at equal distance from the centre.
AB and CD are the two equal chords in the circle. If we draw the perpendicular bisector of these chords then the line segment from the centre to the chord is the distance of the chord from the centre.
If the chords are of equal size then their distance from the centre will also be equal.
Theorem 7: Chords at equal distance from the centre of a circle are also equal in length. This is the reverse of the above theorem which says that if the distance between the centre and the chords are equal then they must be of equal length.
Angle Subtended by an Arc of a Circle
The angle made by two different equal arcs to the centre of the circle will also be equal.
There are two arcs in the circle AB and CD which are equal in length.
So ∠AOB = ∠COD.
Theorem 8: The angle subtended by an arc at the centre is twice the angle subtended by the same arc at some other point on the remaining part of the circle.
In the above figure ∠POQ = 2∠PRQ.
Theorem 9: Angles from a common chord which are on the same segment of a circle are always equal.
If there are two angles subtended from a chord to any point on the circle which are on the same segment of the circle then they will be equal.
∠a = (1/2) ∠c (By theorem 8)
∠b = (1/2) ∠c
∠a = ∠b
Cyclic Quadrilaterals
If all the vertices of the quadrilateral come in a circle then it is said to be a cyclic quadrilateral.
Theorem 10: Any pair of opposite angles of a cyclic quadrilateral has the sum of 180º.
∠A + ∠B + ∠C + ∠D = 360º (angle sum property of a quadrilateral)
∠A + ∠C = 180°
∠B + ∠D = 180º
Theorem 11: If the pair of opposite angles of a quadrilateral has a sum of 180º, then the quadrilateral will be cyclic.
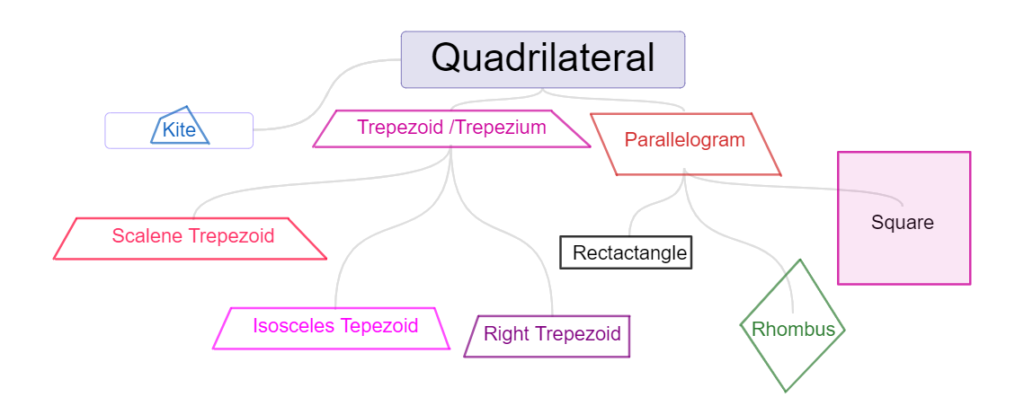
Any closed polygon with four sides, four angles and four vertices are called Quadrilateral. It could be regular or irregular. (Sroll down to continute …)
Study Tools
Audio, Visual & Digital Content
Quadrilateral
Quadrilateral is a closed figure with four sides.
Characteristics of a quadrilateral
Angle Sum Property of a Quadrilateral:
Qudrilateral is a four sided closed figure.
Sum of all angles of a quadrilateral is 360°.
Types Of Quadrilaterals
Classification of quadrilaterals
Quadrilaterals are broadly classified into three categories as:
(i) Kite
(ii) Trapezium
(ii) Parallelogram
Kite:
(i) Kite has no parallel sides
(ii) Kite has a pair of equal adjacent sides.
(ii) It is not a parallelogram
Characteristics Of Kite:
Perimeter Of Square
Area Of Kite
Trapezium:
Trapezium is a quadrilateral with the following characteristics:
(i) One pair of opposite sides is parallel to each other.
(ii) The other pair of opposite sides may not be parallel to each other.
Characteristics Of Trapezium
(i) Sum of all angles of a quadrilateral is 360°.
(ii) One pair of opposite sides is parallel to each other.
(iii) The other pair of opposite sides need not be parallel to each other.
Types Of Trapezium:
Quadrilaterals are broadly classified into two categories as:
(i) Isosceles Trapezium.
(ii) Scalene Trapezium.
(i) Right Trapezium.
Isosceles Trapezium:
Isosceles Trapezium is a quadrilateral with the following characteristics:
(i) One pair of opposite sides is parallel to each other.
(ii) The other pair of opposite sides are equal.
(iii) The other pair of opposite sides need not be parallel to each other.
Isosceles Trapezium is a trapezium with the following characteristics:
(i) One pair of opposite sides is parallel to each other.
(ii) The other pair of opposite sides are equal.
(iii) The other pair of opposite sides need not be parallel to each other.
Characteristics Of Isosceles Trapezium
(i) Sum of all angles of a quadrilateral is 360°.
(ii) One pair of opposite sides is parallel to each other.
(iii) The other pair of opposite sides are equal.
(iv) The other pair of opposite sides need not be parallel to each other.
Scalene Trapezium:
Scalene trapezium: Classified by the length of the legs or the measurement of their angles.
Characteristics Of Scalene Trapezium
Right Trapezium:
Right trapezium: Has one pair of parallel sides and one pair of right angles.
Characteristics Of Right Trapezium
Perimeter Of Trapezium
Area Of Trapezium
Parallelogram:
Parallelogram is a quadrilateral with the following characteristics:
(i) Two pairs of opposite sides are parallel to each other.
(ii) Two pairs of opposite sides are equal in length.
Characteristics of a parallelogram
(i) Sum of all angles of a Parallelogram is 360°.
(ii) Two pairs of opposite sides are parallel to each other.
(ii) Two pairs of opposite sides are equal in length.
(ii) Two pairs of opposite angles are equal.
(iii) Diagonals bisect each other.
(iv) Diagonals need not be equal to each other.
(v) Diagonals divide it into two congruent triangles.
Types Of Parallelogram
Parallelograms are broadly classified into three categories as:
(i) Rectangle
(ii) Rhombus
(iii) Square
Perimeter Of Parallelogram
Area Of Parallelogram
Rectangle:
Rectangleis a quadrilateral with the following characteristics:
(i) Two pairs of opposite sides are parallel to each other.
(ii) Two pairs of opposite sides are equal in length.
(iii) All four angles are right angles. (each angle is 90 o).
Characteristics Of Rectangle
(i) Sum of all angles of a quadrilateral is 360°.
(ii) Two pairs of opposite sides are parallel to each other.
(ii) Two pairs of opposite sides are equal in length.
(iii) All four angles are right angles. (each angle is 90 o).
(iii) Diagonals bisect each other.
(iv) Diagonals are equal to each other.
(v) Diagonals of a rectangle divide it into two congruent triangles.
Conclusions:
Every Rectangle is a Parallelogram. But Every Parallelogram need not to be a Rectangle.
Condition for a rhombus to be a square:
If all four angles of a parallelogram are right angles. (each angle is 90 o), the parallelogram becomes a Rectangle.
Perimeter Of Rectangle
Area Of Recatangle
Rhombus:
Rhombus is a quadrilateral with the following characteristics:
(i) Two pairs of opposite sides are parallel to each other.
(ii) All four sides are equal in length.
Characteristics Of Rhombus
(i) Sum of all angles of a quadrilateral is 360°.
(ii) Two pairs of opposite sides are parallel to each other.
(ii) All four sides are equal in length.
(ii) Two pairs of opposite angles are equal.
(iii) Diagonals bisect each other.
(iv) Diagonals need not be equal to each other.
(v) Diagonals divide a Rhombus into two congruent triangles.
Conclusions:
Every Rhombus is a Parallelogram. But Every Parallelogram need not to be a Rhombus.
Condition for a rhombus to be a square:
If all the sides of a parallelogram are equal, the parallelogram becomes a Rhombus.
Perimeter Of Rhombus
Area Of Rhombus
Square:
Square is a quadrilateral with the following characteristics:
(i) Two pairs of opposite sides are parallel to each other.
(ii) All four sides are equal in length.
(iii) All four angles are right angles. (each angle is 90 o).
Characteristics Of Square
(i) Sum of all angles of a quadrilateral is 360°.
(ii) Two pairs of opposite sides are parallel to each other.
(iii) All four sides are equal in length.
(iv) All four angles are right angles. (each angle is 90 o).
(v) Diagonals bisect each other.
(vi) Diagonals need not be equal to each other.
(vii) Diagonals divide a Rhombus into two congruent triangles.
Conclusions:
Every square is a Rhombus. But Every Rhombus need not to be a square.
Condition for a rhombus to be a square:
If all the angles of a rhombus are right angles (euqal to 90o), the rhombus becomes a square.
2. Every Square is a prallelogram. But Every prallelogram need not to be a square.
Condition for a prallelogramto be a square:
(i) If all the angles of a parallelogram are right angles (euqal to 90o), and all the sides of a parallelogram are equal in length, the parallelogram becomes a square.
3. Every Square is a rectangle. But Every Rectangle need not to be a square.
Condition for a Rectangleto be a square:
If all the sides of a Rectangle are equal in length, the Rectangle becomes a square.
If all the sides of a parallelogram are equal, the parallelogram becomes a Rhombus.
Perimeter Of Square
Area Of Square
Important Points To Remember
The diagonals of a parallelogram are equal if and only if it is a rectangle.
If a diagonal of a parallelogram bisects one of the angles of the parallelogram then it also bisects the opposite angle.
In a parallelogram, the bisectors of any two consecutive angles intersect at a right angle.
The angle bisectors of a parallelogram form a rectangle.
Mid Point Theorem
A line segment joining the mid points of any two sides of a triangle is parallel to the third side and length of the line segment is half of the parallel side.
Converse Of Mid Point Theorem
A line through the midpoint of a side of a triangle parallel to another side bisects the third side.
Intercept Theorem
If there are three parallel lines and the intercepts made by them on one transversal are equal then the intercepts on any other transversal are also equal.
Angle Sum Property of a Quadrilateral
The sum of the four angles of a quadrilateral is 360°
If we draw a diagonal in the quadrilateral, it divides it into two triangles.
And we know the angle sum property of a triangle i.e. the sum of all the three angles of a triangle is 180°.
The sum of angles of ∆ADC = 180°.
The sum of angles of ∆ABC = 180°.
By adding both we get ∠A + ∠B + ∠C + ∠D = 360°
Hence, the sum of the four angles of a quadrilateral is 360°.
Example
Find ∠A and ∠D, if BC∥ AD and ∠B = 52° and ∠C = 60° in the quadrilateral ABCD.
Solution:
Given BC ∥ AD, so ∠A and ∠B are consecutive interior angles.
So ∠A + ∠B = 180° (Sum of consecutive interior angles is 180°).
∠B = 52°
∠A = 180°- 52° = 128°
∠A + ∠B + ∠C + ∠D = 360° (Sum of the four angles of a quadrilateral is 360°).
∠C = 60°
128° + 52° + 60° + ∠D = 360°
∠D = 120°
∴ ∠A = 128° and ∠D = 120 °.
Types of Quadrilaterals
S No.
Quadrilateral
Property
Image
1.
Kite
a. No Parallel Sides b. Two pairs of adjacent sides are equal.
2.
Trapezium
One pair of opposite sides is parallel.
3.
Parallelogram
Both pairs of opposite sides are parallel.
3.
Rectangle
a. Both the pair of opposite sides are parallel. b. Opposite sides are equal.c. All the four angles are 90°.
4.
Square
a. All four sides are equal. b. Opposite sides are parallel. c. All the four angles are 90°.
5.
Rhombus
a. All four sides are equal. b. Opposite sides are parallel. c. Opposite angles are equal.d. Diagonals intersect each other at the centre and at 90°.
Remark: A square, Rectangle and Rhombus are also a parallelogram.
Properties of a Parallelogram
Theorem 1: When we divide a parallelogram into two parts diagonally then it divides it into two congruent triangles.
∆ABD ≅ ∆CDB
Theorem 2: In a parallelogram, opposite sides will always be equal.
Theorem 3: A quadrilateral will be a parallelogram if each pair of its opposite sides will be equal.
Here, AD = BC and AB = DC
Then ABCD is a parallelogram.
Theorem 4: In a parallelogram, opposite angles are equal.
In ABCD, ∠A = ∠C and ∠B = ∠D
Theorem 5: In a quadrilateral, if each pair of opposite angles is equal, then it is said to be a parallelogram. This is the reverse of Theorem 4.
Theorem 6: The diagonals of a parallelogram bisect each other.
Here, AC and BD are the diagonals of the parallelogram ABCD.
So the bisect each other at the centre.
DE = EB and AE = EC
Theorem 7: When the diagonals of the given quadrilateral bisect each other, then it is a parallelogram.
This is the reverse of the theorem 6.
The Mid-point Theorem
1. If a line segment joins the midpoints of the two sides of the triangle then it will be parallel to the third side of the triangle.
If AB = BC and CD = DE then BD ∥ AE.
2. If a line starts from the midpoint of one line and that line is parallel to the third line then it will intersect the midpoint of the third line.
If D is the midpoint of AB and DE∥ BC then E is the midpoint of AC.
Example
Prove that C is the midpoint of BF if ABFE is a trapezium and AB ∥ EF.D is the midpoint of AE and EF∥ DC.
Solution:
Let BE cut DC at a point G.
Now in ∆AEB, D is the midpoint of AE and DG ∥ AB.
By midpoint theorem, G is the midpoint of EB.
Again in ∆BEF, G is the midpoint of BE and GC∥ EF.
Two geometric figures which are the same in shape, such that one is simply a copy of the other on a smaller scale or a larger scale, are called similar geometric figures.
Two geometric figures are said to be similar if and only if they have the same shape but not necessarily the same size. Two congruent geometric figures are always similar but converse may or may not be true. (Scroll down to read more …)
Study Tools
Audio, Visual & Digital Content
Similar Polygons: Two polygons of the same number of sides are similar, if
(i) their corresponding angles are equal and
(ii) their corresponding sides are in proportion or their corresponding sides are in the same ratio.
The same ratio of the corresponding sides is referred to as the representative fraction or the scale factor for the polygons.
Similar Triangles :
Two triangles are said to be similar,
if (i) their corresponding angles are equal and
ii) their corresponding sides are in proportion (are in the same ratio).
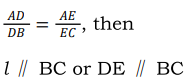
If a line is drawn parallel to one side of a triangle intersecting the other two sides, then it divides the two sides in the same ratio. Or If a line is drawn parallel to one side of a triangle, intersecting the other two sides in distinct points, the other two sides are divided in the same ratio i .e.. If in ∆ABC, l∥ BC, intersecting in D and E. then
Converse of Basic Proportionality Theorem :
If a line divides any two sides of a triangle in the sameratio, the line is parallel to the third side i.e.
In ∆ABC, if l intersects AB in D and AC in E, such that:
Criteria for Similarity of Triangles:
Two triangles are said to be similar, if
(i) their corresponding angles are equal and (ii) their corresponding sides are in proportion (or are in the same ratio).
2 (i) AA or AAA Similarity Criterion : If two angles of one triangle are equal to two corresponding angles of another triangle, then the triangles are similar. If two angles of one triangle are respectively equal to the two angles of another triangle, then the third angles of the two triangles are necessarily equal, because the sum of three angles of a triangle is always 180 0 .
(ii) SAS Similarity Criterion : If one angle of a triangle is equal to one angle of another triangle and the sides including these angles are in the same ratio, then the two triangles are similar. Or If two sides of a triangle are proportional to two corresponding sides of another triangle and the angles included between them are equal, then the triangles are similar.
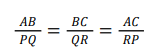
iii) SSS Similarity Criterion : If in two triangles, sides of one triangle are proportional (or are in the same ratio) to the sides of the other triangle, then the triangles are similar. If ∆ABC~ ∆PQR by any one similarity criterion, then ∠A=∠P, ∠B=∠Q, ∠C=∠R and
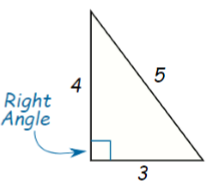
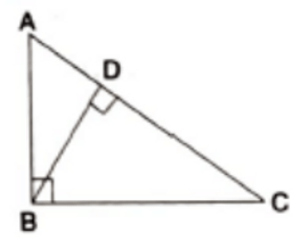
i.e., A and P, B and Q, C and R are the corresponding vertices, also AB and PQ. BC and QR. CA and RP are the corresponding sides. 3 Areas of Similar Triangles: The ratio of the areas of two similar triangles is equal to the square of the ratio of their corresponding sides. – The ratio of the areas of two similar triangles is equal to the square of the ratio of their corresponding medians. – The ratio of the areas of two similar triangles is equal to the ratio of the squares of their corresponding altitudes. – The ratio of the areas of two similar triangles is equal to the ratio of the squares of their corresponding angle bisectors. Pythagoras Theorem : In a right triangle, the square of the hypotenuse is equal to the sum of the squares of the other two sides. Converse of Pythagoras Theorem : In a triangle, if the square of one side is equal to the sum of the squares of the other two sides, then the angle opposite the first side is a right angle. If a perpendicular is drawn from the vertex of the right angle of a right triangle to the hypotenuse, the triangles on each side of the perpendicular are similar to the whole triangle and similar to each other i .e ..
If in ∆ABC, ∠B=90^0 and BD ⊥ AC, then (i) ∆ADB ~ ∆ABC (ii) ∆BDC ~ ∆ABC (iii) ∆ADB ~ ∆BDC
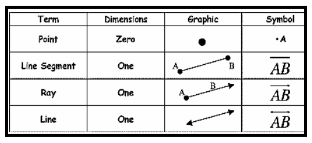
1. Point – A Point is that which has no component. It is represented by a dot.
2. Line – When we join two distinct points then we get a line. A line has no endpoints; it can be extended on both sides infinitely.
3. Line Segment Line – Segment is the part of the line which has two endpoints.
4. Ray – Ray is also a part of the line that has only one endpoint and has no end on the other side.
5. Collinear points: Points lying on the same line are called Collinear Points.
6. Non-collinear points: Points which do not lie on the same line are called Non-Collinear Points. (Scroll to continue …)
Study Tools
Audio, Visual & Digital Content
Angles
When two rays begin from the same endpoint then they form an Angle. The two rays are the arms of the angle and the endpoint is the vertex of the angle.
Types of Angles
Angle
Notation
Image
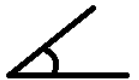
Acute
An angle which is between 0° and 90°.
Right
An angle which is exactly equal to 90°.
Obtuse
An angle which is between 90° and 180°.
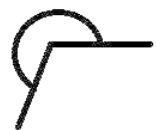
Reflex
An angle which is between 180° and 360°
Straight
An angle which is exactly equal to 180°.
Complete
An angle which is exactly equal to 360°.
Types of Angles
Complementary and Supplementary Angles
Complementary Angles are the different angles whose sum is 90°.
Complementary Angles are the different angles whose sum is 180°.
Intersecting Lines and Non-intersecting Lines
There are two ways to draw two lines-
1. The lines which cross each other from a particular point are called Intersecting Lines.
2. The lines which never cross each other at any point are called Non-intersecting Lines. These lines are called Parallel Lines and the common length between two lines is the distance between parallel lines.
Pairs of Angles Axioms
1. If a ray stands on a line, then the sum of two adjacent angles formed by that ray is 180°.
This shows that the common arm of the two angles is the ray which is standing on a line and the two adjacent angles are the linear pair of the angles. As the sum of two angles is 180° so these are supplementary angles too.
2. If the sum of two adjacent angles is 180°, then the arms which are not common of the angles form a line.
This is the reverse of the first axiom which says that the opposite is also true.
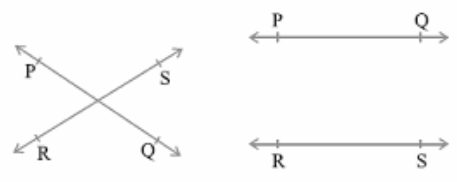
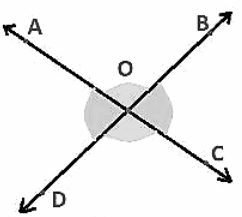
Vertically opposite Angles Theorem
When two lines intersect each other, then the vertically opposite angles so formed will be equal.
AC and BD are intersecting each other so ∠AOD = ∠BOC and ∠AOB = DOC.
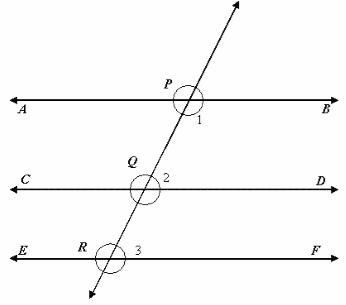
Parallel Lines and a Transversal
If a line passes through two distinct lines and intersects them at distant points then this line is called Transversal Line.
Here line “l” is transversal of line m and n.
Exterior Angles – ∠1, ∠2, ∠7 and ∠8
Interior Angles – ∠3, ∠4, ∠5 and ∠6
Pairs of angles formed when a transversal intersects two lines-
1. Corresponding Angles:
∠ 1 and ∠ 5
∠ 2 and ∠ 6
∠ 4 and ∠ 8
∠ 3 and ∠ 7
2. Alternate Interior Angles:
∠ 4 and ∠ 6
∠ 3 and ∠ 5
3. Alternate Exterior Angles:
∠ 1 and ∠ 7
∠ 2 and ∠ 8
4. Interior Angles on the same side of the transversal:
∠ 4 and ∠ 5
∠ 3 and ∠ 6
Transversal Axioms
1. If a transversal intersects two parallel lines, then
Each pair of corresponding angles will be equal.
Each pair of alternate interior angles will be equal.
Each pair of interior angles on the same side of the transversal will be supplementary.
2. If a transversal intersects two lines in such a way that
Corresponding angles are equal then these two lines will be parallel to each other.
Alternate interior angles are equal then the two lines will be parallel.
Interior angles on the same side of the transversal are supplementary then the two lines will be parallel.
Lines Parallel to the Same Line
If two lines are parallel with a common line then these two lines will also be parallel to each other.
As in the above figure if AB ∥ CD and EF ∥ CD then AB ∥ EF.
Angle Sum Property of a Triangle
1. The sum of the angles of a triangle is 180º.
∠A + ∠B + ∠C = 180°
2. If we produce any side of a triangle, then the exterior angle formed is equal to the sum of the two interior opposite angles.
Introduction to Euclid Geometry The necessity of geometry had been felt from ancient times in different parts of the world.
The practical problems faced by people of ancient civilization had developed this branch of mathematics.
Let us cite few examples.
With floods in the river, the demarcations of land owners on the river-side land were used to wipe out. (Scroll down to continue …)
Study Tools
Audio, Visual & Digital Content
In order to redraw the boundaries, the idea of area was introduced, the idea of area was introduced.
The volumes of granaries could be measured by using geometry.
The existence of Egyptian pyramids indicates the use of geometry from olden times.
In Vedic period, there was a manual of geometrical construction, known as Sulbasutra’s.
Different geometrical shapes were constructed as altars to perform various Vedic rites.
The word Geometry originates from the green word ‘Geo’ (earth) and metrein (to measure) Through Geometry was developed and applied from ancient time in various part the world, it was not presented in a systematic manner.
Later in 300 BC, the Egyptian mathematician Euclid, collected all the known work and arranged it in a systematic manner.
‘Elements’ is a classic treatise in geometry which was written by Euclid.
This was the most influential book. The ‘element’ was used as a text book for several years in western Europe.
The ‘elements’ started with 28 definitions, five postulates and five common notions and systematically built the rest of plane and solid geometry.
The geometrical approach given by Euclid is known as Euclid method.
The Euclid method consists of making a small set of assumptions and then proving many other proposition from these assumptions.
The assumptions, made were obvious universal truth. The two types of assumption, made were ‘axioms’ and ‘postulates’.
Euclid’s Definitions Euclid listed 23 definitions in book 1 of the ‘elements’.
We list a few of them: 1) 2) 3) 4) 5) 6) 7) A point is that which has no part A line is a breadth less length The ends of a line are points A straight line is a line which lies evenly with the points on itself. A surface is that which has length and breadth only.
The edges of a surface are lines A plane surface is surface which lies evenly with straight lines on its self. Starting with these definitions, Euclid assumed certain assumptions, known as axioms and postulates.
Euclid’s Axioms Axioms were assumptions which were used throughout mathematics and are not specifically linked to geometry.
Few of Euclid’s axioms are:
1) Things which are equal to the same thing are equal to one another.
2) It equals are added to equals; the wholes are equal.
3) 4) 5) 6) 7) If equals are subtracted from equals, the remainders are equal.
Things which coincide one another are equal to one another.
The whole is greater than the part Things which are double of the same thing are equal to one another.
Things which are half of the same things are equal to one another.
All these axioms refer to magnitude of same kind.
Axiom – 1 can be written as follows: If x = Z and y = Z, then x = y
Axiom – 2 explains the following: If x = y, then x + Z = y + Z According to axiom – 3, If x = y, then x – Z = y – Z Axiom – 4 justifies the principle of superposition that every thing equals itself.
Axiom – 5, gives us the concept of comparison. If x is a part of y, then there is a quantity Z such that x = y + Z or x > y Note that magnitudes of the same kind can be added, subtracted or compared.
Euclid’s Postulates Euclid used the term postulate for the assumptions that were specific to geometry. Euclid’s five postulates are as follows: Postulate 1: A straight line may be drawn from any one point to any other point. Same may be stated as axiom 5.1 Given two distinct points, there is a unique line that passes through them.
Postulate 2: A terminated line can be produced indefinitely. Postulate 3: A circle can be drawn with any centre and any radius. Postulate 4: All right angles are equal to one another. Postulate 5: If a straight line falling on two straight lines makes the interior angle on the same side of it taken together less than two right angles, then two straight lines, if produced indefinitely, meet on that side on which the sum of the angles is less than two right angles. Postulates 1 to Postulates 4 are very simple and obvious and therefore they are taken a ‘self evident truths’. Postulates 5 is complex and it needs to be discussed. Suppose the line XY falls on two lines AB and CD such that ∠1 + ∠2 < 180°, then the lines AB and CD will intersect at a point. In the given figure, they intersect on left side of PQ, if both are produced. Note: In mathematics the words axiom and postulate may be used interchangeably, though they have distinct meaning according to Euclid. System of Consistent Axioms A system of axioms is said to be consistent, if it is impossible to deduce a statement from these axioms, which contradicts any of the given axioms or proposition. Proposition or Theorem The statement or results which were proved by using Euclid’s axioms and postulates are called propositions or Theorems. Theorem: Two distinct lines cannot have more than one point in common. Proof: Given: AB and CD are two lines. To prove: They intersect at one point or they do not intersect. Proof: Suppose the lines AB and CD intersect at two points P and Q. This implies the line AB passes through the points P and Q. Also the line CD passes through the points P and Q. This implies there are two lines which pass through two distinct point P and Q. But we know that one and only one line can pass through two distinct points. This axiom contradicts out assumption that two distinct lines can have more than one point in common. The lines AB and CD cannot pass through two distinct point P and Q. Equivalent Versions of Euclid’s Fifth Postulate The two different version of fifth postulate a) For every line l and for every point P not lying on l, there exist a unique line m passing through P and parallel to l. b) Two distinct intersecting lines cannot be parallel to the same line.


 Term
Term term.
term.