Mind Map Overal Idea Content Speed Notes Quick Coverage Content : (Scroll down till end of the page) Study Tools Audio, Visual & Digital Content Content … Key Terms Topic Terminology Term Important Tables Table: . Assessments Test Your Learning readmore
Mind Map Overal Idea Content Speed Notes Quick Coverage There are three types of Substances: Acids, Bases and Salts Acids: Acids are sour in taste. They are corrosive in nature. A concentrated acid cuts through clothes and eats away the wool. If it falls on the skin, it can cause burns. They are good conductors… readmore
Mind Map
Overal Idea
Content
Speed Notes
Quick Coverage
There are three types of Substances: Acids, Bases and Salts
Acids: Acids are sour in taste. They are corrosive in nature.
A concentrated acid cuts through clothes and eats away the wool.
If it falls on the skin, it can cause burns.
They are good conductors of electricity, as they allow the passage of electric current through them. (Scroll down till end of the page)
Study Tools
Audio, Visual & Digital Content
Types of Acids:
(i) Mineral Acids: These are acids prepared from minerals present in the earth’s crust.
(ii) OrganicAcids: These are acids produced by plants and animals (except hydrochloric acid).
Weak Acids: These do not dissociate completely in solution.
Examples: tartaric acid, lactic acid.
Strong Acids: These dissociate completely in solution. Example: nitric acid, sulphuric acid.
Neutralization: It is the reaction between an acid and a base which results in formation of salt and water.
Acid + Base ———-> Salt + Water
Example: HCl + NaOH ———-> NaCl + H2O
Neutralisation in Everyday Life:
Indigestion: Too much acid in stomach causes indigestion. It is neutralized by taking an antacid like milk of magnesia.
Ant sting: When an ant bites, it injects formic acid into the skin. The effect is neutralized by rubbing moist baking soda (sodium hydrogen carbonate) or calamine (containing zinc carbonate).
(iii) Soil treatment: When the soil is too acidic, it is neutralized by treating with
quicklime (calcium oxide) or slaked lime (calcium hydroxide).
Bases: Bases are bitter in taste and soapy to touch.
Types of Bases:
Weak Bases: These naturally produce less hydroxide ions in solution. Example: magnesium hydroxide, ammonium hydroxide.
Strong Bases: These produce more number of hydroxide ions on dissolving in water. Example: Sodium hydroxide(NaOH), Potassium hydroxide (KOH)
Substances which are neither acidic nor basic are called neutral.
An acid and a base neutralise each other and form a salt. A salt may be acidic, basic or neutral in nature.
Solutions of substances that show different colour in acidic, basic and neutral solutions are called indicators.
Indicators: It is special chemical that changes its colour to indicate the presence of a chemical substance.
It is used to confirm the presence of an acid, a base or a neutral solution.
Classification of Indicators:
Natural Indicators:
Litmus: It is extracted from lichens. It is available in the form of strips of paper or in the form of a solution.· Acid turns blue litmus red. Bases turn red litmus blue.
Turmeric: It remains yellow in neutral and acidic solutions but turns red in alkaline solutions.
China rose: It turns acidic solutions to dark pink (magenta) and basic solution to green.
Red cabbage: It turns acidic solutions to red and basic solutions to blue.
Other Indicators:
Methyl Orange: It gives pinkish red colour with acidic solutions and yellow colour with bases.
Phenolphthalein: It is an acid-base indicator. It is colourless in acidic solutions but turns pink in alkali solutions.
Mind Map Overal Idea Content Speed Notes Quick Coverage Natural Resources: Resources include everything provide by the nature. They form the wealth of a country. Types of Natural Resources:(i) Inexhaustible: There are some resources that are present unlimited in nature and will not be exhausted even if used continuously. Example: Sunlight, Air. (Scroll down till… readmore
Mind Map
Overal Idea
Content
Speed Notes
Quick Coverage
Natural Resources: Resources include everything provide by the nature. They form the wealth of a country.
Types of Natural Resources: (i) Inexhaustible: There are some resources that are present unlimited in nature and will not be exhausted even if used continuously.
Example: Sunlight, Air. (Scroll down till end of the page)
Study Tools
Audio, Visual & Digital Content
Natural Resources: Resources include everything provide by the nature. They form the wealth of a country.
Types of Natural Resources: (i) Inexhaustible: There are some resources that are present unlimited in nature and will not be exhausted even if used continuously.
Example: Sunlight, Air.
(ii) Exhaustible: These resources are limited and can soon get exhausted because of Coal, petroleum and natural gas are fossil fuels.
Fossil fuels were formed from the dead remains of living organisms millions of yearsago.
Fossil fuels are exhaustible resources.
Coke, coal tar and coal gas are the products of coal.
Petroleum gas, petrol, diesel, kerosene, paraffin wax, lubricating oil are obtained by refining petroleum.
Coal and petroleum resources are limited.
We should use them judiciously.
Petroleum is mixture of various constituents such as petroleum gas, petrol, diesel, lubricating oil, paraffin wax, etc.
Refining: Refining is the process of refracting the various constituents / fractions of petroleum.
It carried out in a petroleum refinery.
Natural Gas: A very important fuel as it easy to transport through pipes and can be compressed and stored under high pressure as Compressed Natural Gas (CNG).
It causes no pollution and has high calorific value.
Mind Map Overal Idea Content Speed Notes Quick Coverage Data Handling: Deals with the process of collecting data, presenting it and getting result. Data mostly available to us in an unorganised form is called raw data. (Scroll down till end of the page) Study Tools Audio, Visual & Digital Content Grouped data can be presented… readmore
Mind Map
Overal Idea
Content
Speed Notes
Quick Coverage
Data Handling: Deals with the process of collecting data, presenting it and getting result.
Data mostly available to us in an unorganised form is called raw data. (Scroll down till end of the page)
Study Tools
Audio, Visual & Digital Content
Grouped data can be presented using histogram. Histogram is a type of bar diagram, where the class intervals are shown on the horizontal axis and the heights of the bars show the frequency of the class interval. Also, there is no gap between the bars as there is no gap between the class intervals.
In order to draw meaningful inferences from any data, we need to organise the data systematically.
Frequency gives the number of times that a particular entry occurs.
Raw data can be ‘grouped’ and presented systematically through ‘grouped frequency distribution’.
Statistics: The science which deals with the collection, presentation, analysis and interpretation of numerical data.
Observation: Each entry (number) in raw data.
Range: The difference between the lowest and the highest observation in a given data.
Array: Arranging raw data in ascending or descending order of magnitude. Data can also presented using circle graph or pie chart. A circle graph shows the relationship between a whole and its part.
There are certain experiments whose outcomes have an equal chance of occurring. A random experiment is one whose outcome cannot be predicted exactly in advance. Outcomes of an experiment are equally likely if each has the same chance of occurring.
Frequency: The number of times a particular observation occurs in the given data.
Class Interval: A group in which the raw data is condensed.
(i) Continuous: The upper limit of a class interval coincides with the lower limit of the next class.
Mind Map Overal Idea Content Speed Notes Quick Coverage Perimeter Perimeter is defined as the outside boundary of any closed shape. To calculate the perimeter of a given shape we need to add all the sides of the shape. Example: The perimeter of a rectangle is the sum of its all four sides. The unit… readmore
Mind Map
Overal Idea
Content
Speed Notes
Quick Coverage
Perimeter
Perimeter is defined as the outside boundary of any closed shape.
To calculate the perimeter of a given shape we need to add all the sides of the shape.
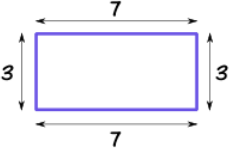
Example: The perimeter of a rectangle is the sum of its all four sides. The unit of the perimeter is the same as its length.
Perimeter of the Given rectangle = 3 + 7 + 3 + 7 cm
Perimeter of rectangle = 20 cm. (Scroll down till end of the page)
Study Tools
Audio, Visual & Digital Content
Area
Area of any closed figure is the surface enclosed by the perimeter. Unit of Area is the square of the unit of length.
Area of a triangle
The general formula to find the area of a triangle, if the height is given, is
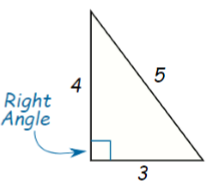
Area of a Right Angled Triangle
To find the area of a right-angled triangle, we use the formula:
right-angled triangle, we take the two sides having the right angle, one as the base and one as height.
Example: Calculate area of a triangle of the Figure.
Data: base = 3 cm and height = 4 cm
Formula: Area of triangle = 1/2 × 3 × 4= 6 cm 2
Result: Area of a triangle of the Figure is 6 cm 2 .
Remark: If you take base as 4 cm and height as 3 cm then also the area of the triangle will remain the same.
Area of Equilateral Triangle
Equilateral Triangle: Equilateral Triangle is defined as a triangle having three equal sides.
To calculate the area of the Equilateral Triangle ABC,
We calculate the height (altitude), AD by making the median of the triangle.
In the given example, the Height (altitude), AD touches Base of the equilateral triangle at the midpoint of BC, Say point, D.
Here the equilateral triangle ABC has three equal sides, such as:
AB = BC = AC = 10 cm.
Since, midpoint of BC divides the triangle into two right angle triangles.
The height, AD, is calculated using Pythagoras theorem.
According to Pythagoras theorem, AB2 = AD2 + BD2
On substituting the values we get,
(10)2 = AD2 + (5)2
AD2 = (10)2 – (5)2
AD2 = 100 – 25 = 75
AD = 5√3
Now we can find the area of the triangle using the formula:
Area of triangle = 1/2 × base × height
On substituting the values we get,
Area of triangle = 1/2 × 10 × 5√3
25√3 cm2
Area of Isosceles Triangle
In the isosceles triangle also we need to find the height of the triangle then calculate the area of the triangle.
Here,
Area of a Triangle — by Heron’s Formula
The formula of the area of a triangle given by herons is called Heron’s Formula.
Heron’s Formula:
where a, b and c are the sides of the triangle and s is the semiperimeter
Generally, this formula is used when the height of the triangle is not possible to find or you can say if the triangle is a scalene triangle.
Here the sides of triangle are
AB = 12 cm
BC = 14 cm
AC = 6 cm
Application of Heron’s Formula in Finding Areas of Quadrilaterals
If we know the sides and one diagonal of the quadrilateral then we can find its area by using the Heron’s formula.
Find the area of the quadrilateral if its sides and the diagonal are given as follows.
Given, the sides of the quadrilateral
AB = 9 cm
BC = 40 cm
DC = 28 cm
AD = 15 cm
Diagonal is AC = 41 cm
Here, ∆ABC is a right angle triangle, so its area will be
Area of Quadrilateral ABCD = Area of ∆ABC + Area of ∆ADC
Mind Map Overal Idea Content Speed Notes Quick Coverage Graphical presentation of data is easier to understand. A bar graph is used to show comparison among categories. A pie graph is used to compare parts of a whole. A Histogram is a bar graph that shows data in intervals. (Scroll down till end of the… readmore
Mind Map
Overal Idea
Content
Speed Notes
Quick Coverage
Graphical presentation of data is easier to understand.
A bar graph is used to show comparison among categories.
A pie graph is used to compare parts of a whole.
A Histogram is a bar graph that shows data in intervals. (Scroll down till end of the page)
Study Tools
Audio, Visual & Digital Content
Introduction to Graphs
A line graph displays data that changes continuously over periods of time. A line graph which is a whole unbroken line is called a linear graph.
For fixing a point on the graph sheet we need, x-coordinate and y-coordinate.
The relation between dependent variable and
through a graph.
independent variable is shown
A Bar Graph: A pictorial representation of numerical data in the form of bars (rectangles) of uniform width with equal spacing. The length (or height) of each bar
represents the given number.
A Pie Graph: A pie graph is used to compare parts of a whole. The various
observations or components are represented by the sectors of the circle.
A Histogram: Histogram is a type of bar diagram, where the class intervals are shown on the horizontal axis and the heights of the bars (rectangles) show the frequency of the class interval, but there is no gap between the bars as there is no gap between the
class intervals.
Linear Graph: A line graph in which all the line segments form a part of a single line. Coordinates: A point in Cartesian plane is represented by an ordered pair of numbers.
Ordered Pair: A pair of numbers written in specified order.